Using Instana to monitor MQ queues
Goals
In this lab you wil learn how Instana can be used to monitor queues in MQ.
Prerequisites
There are no prerequisites for this lab other than having a browser and an internet connect, without which you wouldn't be here ;-)
We show examples of using curl to issue commands, but these commands can be executed via the browser as well so it isn't required that you have curl installed.
Environment Overview
The environment configured for this lab is illustrated here. You will interact with a MQ Application running on an OpenShift cluster and use Instana running in a Virtual Server Instance to view the data from MQ.
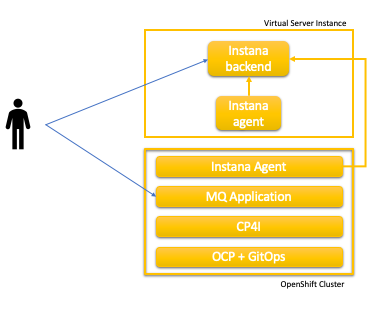
Virtual Server Instance
The Instana backend server is installed on a Virtual Server Instance (VSI) running on the IBM Cloud. You will utilize the Instana UI to view the metrics data stored there. This metric data is captured by Instana agents which forwards the data to the Instana backend. There is an agent running on the VSI instance as well as agents running in the OpenShift Cluster.
Openshift Cluster
The Openshift cluster contains the following components.
- Instana Agent
- MQ Application
- Cloud Pak for Integration (CP4I)
- OCP + GitOps
Instana Agent
The Instana Agent captures metric data from the Openshift Cluster and forwards it to the Instana backend server.
MQ Application
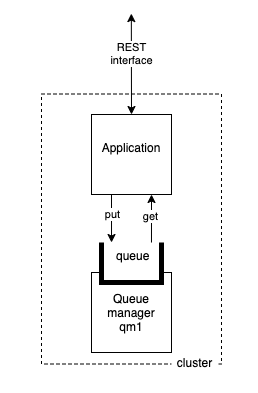
The MQ Application is a simple application that provides a REST interface to put and get messages on a MQ queue.
Cloud Pak for Integration (CP4I)
The CP4I component hosts the MQ queue used by the MQ Application.
OCP + GitOps
The OCP + GitOps components are used to deploy components into the OpenShift cluster.
If you would like more information on the MQ Application, CP4I, and OCP + GitOps components; review this MQ Tutorial which was used to deploy the environment.
The Instana Agent on OpenShift was deployed using this Quick Start Demo
Generate metric data
In this section you will use the MQ Application to generate metric data for the Instana agent to capture and froward to the Instana backend
The MQ Application is running in Application pods on the OpenShift Cluster. It exposes a REST interface with methods to put and get messages from a queue running in Queue manager pods in the cluster.
You can use the MQ Application UI, or curl, or both to generate metric data.
Use the MQ Application UI
-
Open the MQ Application UI in a new browser window.
-
Click on
mq-client-controllerto expand that section. -
Click on
/api/send-hello-worldto expand that section. -
Click on the Try it out button
-
Click on the Execute button. You should receive a
200response code along with the following response body{ "status": "OK", "statusMessage": "Successfully sent record to MQ", "data": "Hello World!" } -
Scroll down and click on
/api/send-jsonto expand that section -
Click on the Try it out button
-
Enter the following json in the
Example Value | Modeltext area.{ "data": "Hola Mundo!"} -
Click on the Execute button. You should receive a
200response code along with the following response body{ "status": "OK", "statusMessage": "Successfully sent record to MQ", "data": "{\n \"data\" : \"Hola Mundo!\"\n}" } -
Scroll up and click on
/api/recvto expand that section -
Click on the Try it out button
-
Click on the Execute button. You should receive a
200response code along with a response body containing a message similar to the following{ "status": "OK", "statusMessage": "Successfully sent record to MQ", "data": "{\n \"data\" : \"Hola Mundo!\"\n}" }Note
The actual message returned could be from other users of the application and not the ones you sent.
Warning
If you receive a
504error code and anError: Gateway Time-outmessage that indicates there are no messages on the queue. Put a few more on the queue and try again. -
Feel free to put and get as many messages as you wish.
Use curl
If you have curl installed you can use the follow steps to get and put messages. Otherwise continue to the next section.
-
To make the following
curlcommands easier to read and understand create an environment variable for the app url
export APP_URL="mq-spring-app-dev.instana-mq-6qwkjtsh-b9aa1303e037748136e24e1f282ebee9-0000.us-south.containers.appdomain.cloud" -
Now execute the command to put the "Hello World!" message on the queue
You should see the responsecurl -X GET https://$APP_URL/api/send-hello-world{"status":"OK","statusMessage":"Successfully sent record to MQ","data":"Hello World!"} -
Now execute the command to put a JSON message on the queue
You should see the responsecurl -X POST -H "Content-Type: application/json" https://$APP_URL/api/send-json --data "{\"data\":\"Hola Mundo\!\"}"{"status":"OK","statusMessage":"Successfully sent record to MQ","data":"{\n \"data\" : \"Hola Mundo\"\n}"} -
Now execute the command to get a message from the queue
You should see a response similar to thiscurl -X GET https://$APP_URL/api/recv{"status":"OK","statusMessage":"Successfully sent record to MQ","data":"{\n \"data\" : \"Hola Mundo!\"\n}"}Note
The actual message returned could be from other users of the application and not the ones you sent.
Warning
If you receive a 504 error code and an Error: Gateway Time-out message that indicates there are no messages on the queue. Put a few messages on the queue and try again.
Browse Instana UI
In this section you will Browse the Instana UI
-
Log in to the Instana UI
- Open the Instana UI in a browser tab.
- Accept the security risks.
- Enter the following E-mail
demos@cloudnativetoolkit.dev - Enter the following Password
xzt4fqp.pxw!MKC8pmh - Click Sign In
- You know have read-only access to the Instana Dashboard.
-
Review the Instana home page
- Use the Time Range button in the upper right to select the range of data to be displayed. Select Last 30 minutes
- The sections on the home page correspond with the menu on the left.
- The Websites & Mobile Apps section displays high level metrics on registered applications. There are no applications registered in this lab. Look at the Instana & Grafana quick start demo for an example on that
- The Applications section displays high level metrics on requests too and from services
- The Platforms section displays high level metrics on platforms such as our OpenShift Cluster, named
MQ Cluster - The Infrastructure section displays high level metrics on lower level components. In our case the cluster worker nodes and the VSI of the Instana backend.
- The Events section displays displays high level metrics on incidents, events and changes.
-
Review the Applications page
- Under
Applicationsclick on All Services - The Summary page displays information such as the number of calls, error rate and latency
- Click on the Dependencies tab
-
The Dependencies page displays the interactions between the services. The interaction of interest to this lab is between the
mq-spring-appwhich is our MQ Application and theIBM.DEMO.Qwhich is the MQ queue running in CP4I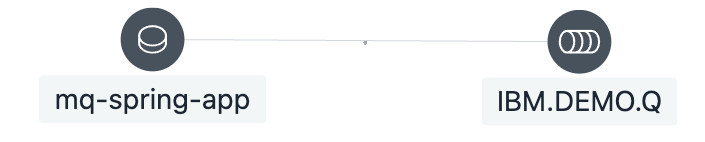
-
Click on the Services tab
- The Services page show high level summery of the services.
- Click on the
mq-spring-appservice - The Summary page displays detail metrics on the
mq-spring-appservice - Click on the Flow tab
- Again you will see the relationship between the
mq-spring-appand theIBM.DEMO.Qqueue along with then number of calls, latency and errors. - Click on the Endpoints tab
- This will be a list of the endpoints of our
mq-spring-app - Click on the GET /api/recv endpoint
- This is the Summary page for the selected endpoint.
- Click on the Flow tab
-
Again you can see the relationship between this
mq-spring-appendpoint and theIBM.DEMO.Q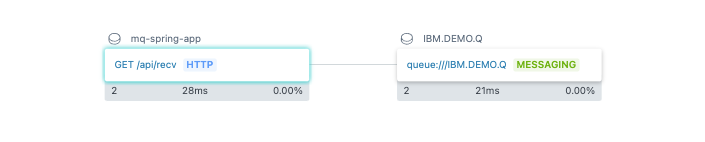
-
Now click on the
queue:///IBM.DEMO.Qlink - This is the Summary page of the queue
- You see how you can drill down into services to view metrics at different levels.
- Explore the
Applicationpage on your own. Continue to the next step when you are done.
- Under
-
Review the Platforms page
-
On the side menu click on Platforms -> Kubernetes
-
A list of monitored clusters with high level metrics is displayed
- Click on the
MQ Cluster - The Summary page for the cluster is displayed. You see see metrics for the cluster such as CPU, Memory and Pods.
- Click on the Nodes tab
- The list of cluster nodes is displayed
-
Explore the other tabs on your own to view the lists of Pods, Deployments, etc. Feel free to click components listed to view their details. When you are done exploring click on the MQ Cluster (cluster) breadcrumb at the top.

-
Click on the Namespaces tab
-
A list of the cluster namespaces is displayed. In the search box enter
dev. Our services are deployed in thedevnamespace so click on the dev name to view the summary page.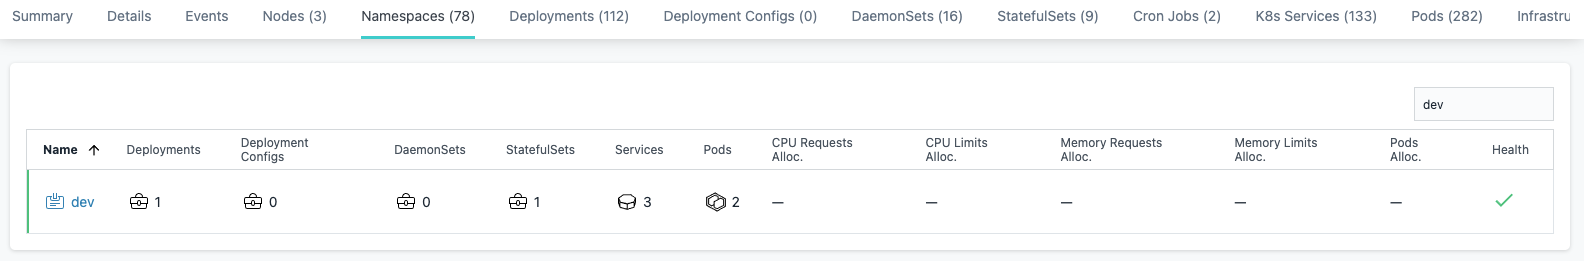
-
The Summary page for the
devnamespace displays information on CPU, Memory and pods for the namespace. - Click on the Deployments tab
- The
mq-spring-appdeployment is listed. Click on it. -
The
mq-spring-appsummary page is displayed. Explore the tabs on your own. Once done click on the dev breadcrumb at the top
-
Click on the StatefulSet tab
- The MQ queue is deployed via the
qm1-ibm-mq, click on it. - The
qm1-ibm-mqsummary page is displayed. Explore the tabs on your own. Once done continue to the next section.
-
-
Review the Infrastructure page
-
On the side menu click on Infrastructure
-
A map is displayed of the Infrastructure. The
InstanaTechnologyZoneis the zone where the the VSI is running and you can see that in contains the single VSI instance. TheMQ Zoneis the zone where theMQ Clusteris running. The 3 nodes are displayed in that zone. -
Click on the
MQ ZoneNAME on the map.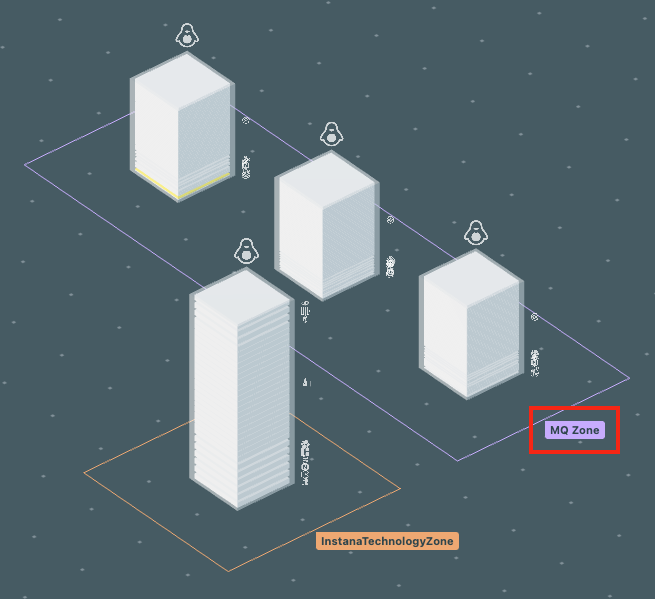
-
On the MQ Zone pop-up window click on the Open Dashboard button
- The MQ Zone dashboard displays the Hosts, the 3 nodes, in the cluster.
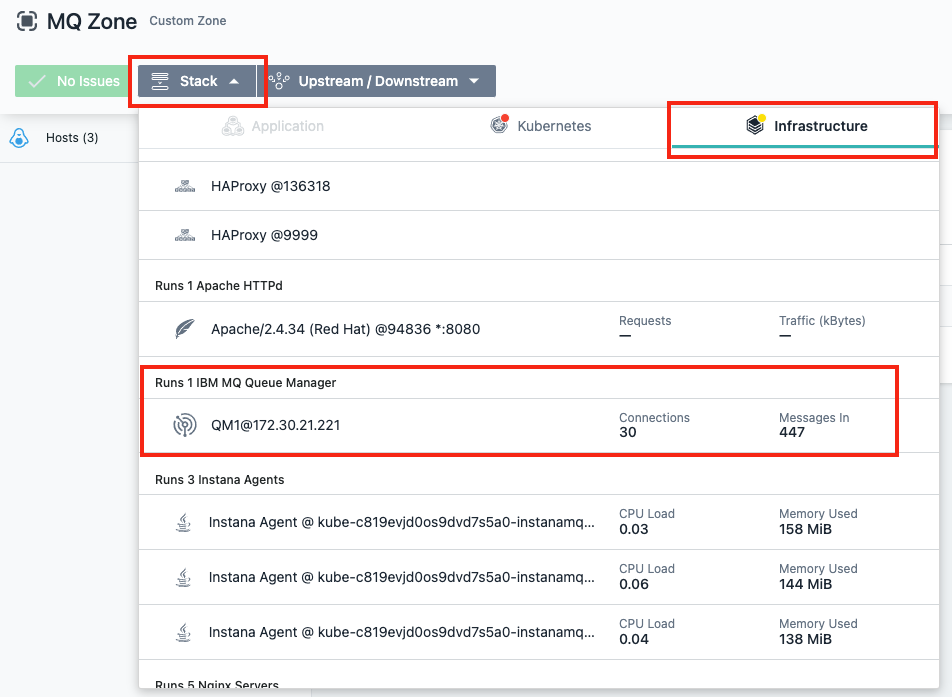
-
Click on the Stack button, select the Infrastructure tab and scroll through the list until you find the QM1@172.30.21.221 queue manager. NOTE: the IP Address might be different.
-
The details of the
MQ1Queue manager is displayed. -
Before looking at these details there is an easier way to navigate to this page. Click on the Map breadcrumb at the top to return to the infrastructure map.

-
You can create and use filters to find components on the map. We have created a Queue Managers filter that filters the map on
entity.ibmmq.qm.name:"*"objects. Click the Filters drop-down and select Queue Managers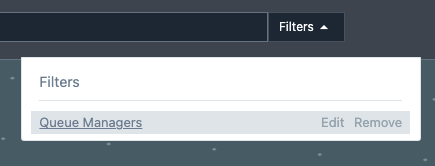
-
The QM1@172.30.21.221 queue manager is displayed on the map in the MQ Zone. Click on the IBM MQ Queue Manager component
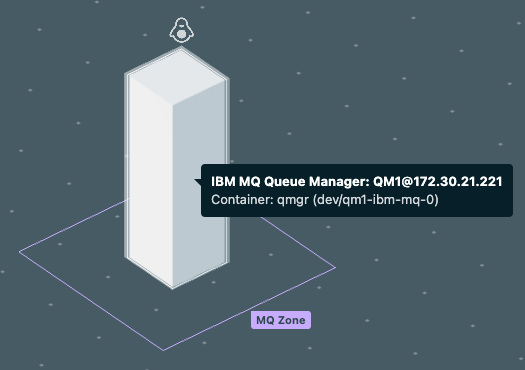
-
On the
IBM MQ Queue Managerpop-up click Open Dashboard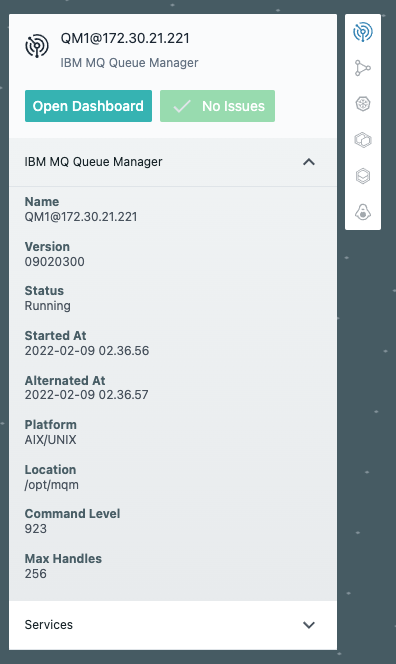
-
You are back to the
MQ1Queue manager details page. - Detailed information about the queue manager, such as number of connections and number of messages, are displayed on this page.
- Scroll down and you will see the
MQ1queue managers Topics, Subscriptions, Listeners, Queues, and Channels - The
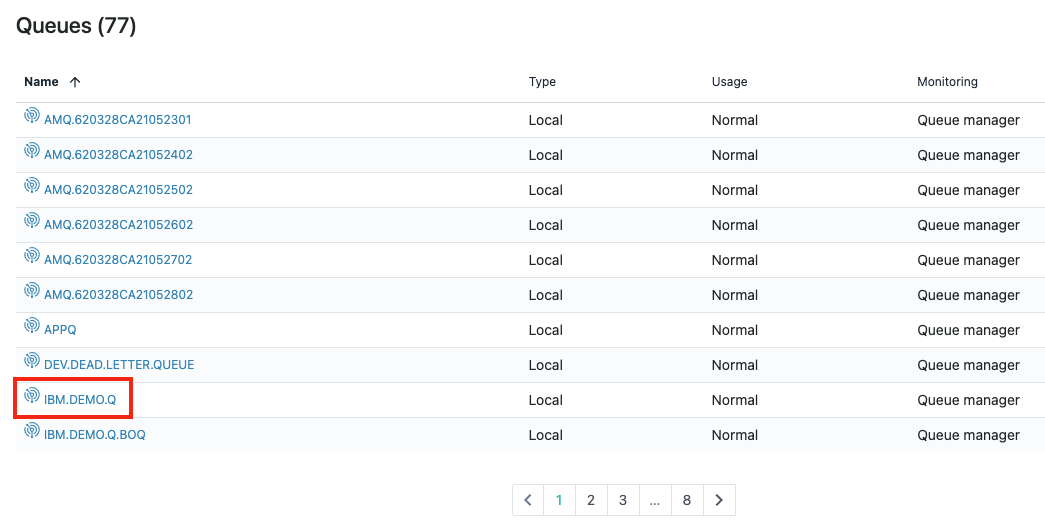
IBM.DEMO.Qis the queue used by ourmq-spring-appso lets look at its details. -
In the Queues section, NOT Queues Usage by application, click on IBM.DEMO.Q
-
The queue details page displays information like queue depth, number of messages in/out, message time and calls.
-
On the charts you can turn on/off the elements that are displayed. For example the Depth chart displays the
Maxdepth and theCurrentmessage depth. Themaxdepth is 5000 and is represented by the line at the top. Since ourCurrentmessage depth is so low and the value changes so little it is represented by a line at the bottom of the cart and it is difficult to see it change. Click on the Max element at the top of the chart to turn it off and that makes it easier to see theCurrentmessage depth change.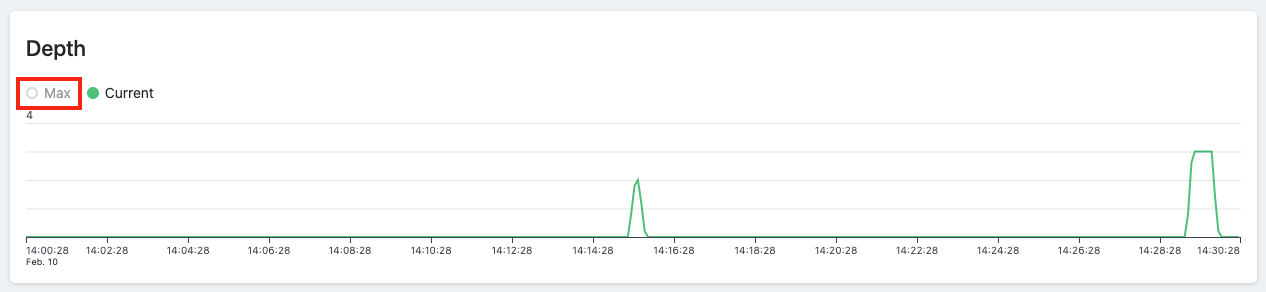
-
Lets move on to the next section
-
View Live MQ Metric Data
In this section you will put and get messages from the queue and monitor them live on the Instana UI.
- You should be on the
IBM.DEMO.Qdetails page from the previous section. If not navigate there now. -
On the
IBM.DEMO.Qdetails page click the Live button on the top, right of the screen. This will toggle the charts to be update in real time. To make it easier to see the messages in the queue make sureMaxdepth element is turned off on the Depth chart.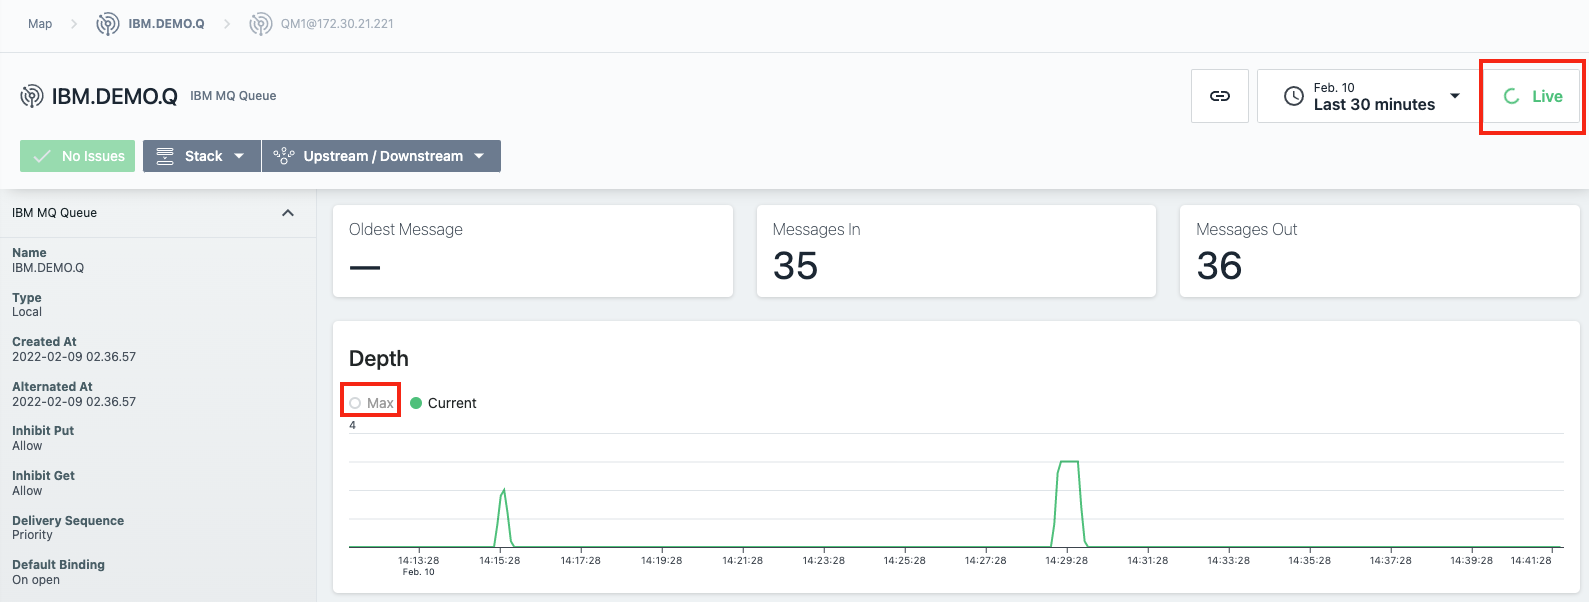
-
Put and get messages from the queue using either the MQ Application ui or curl as described in the Generate metric data section above.
-
As messages are placed on and removed from the queue you can see the
Depthchart and theMessagescharts being updated. Note: the Instana agent is configured to send updates every 5 seconds so there is a slight delay.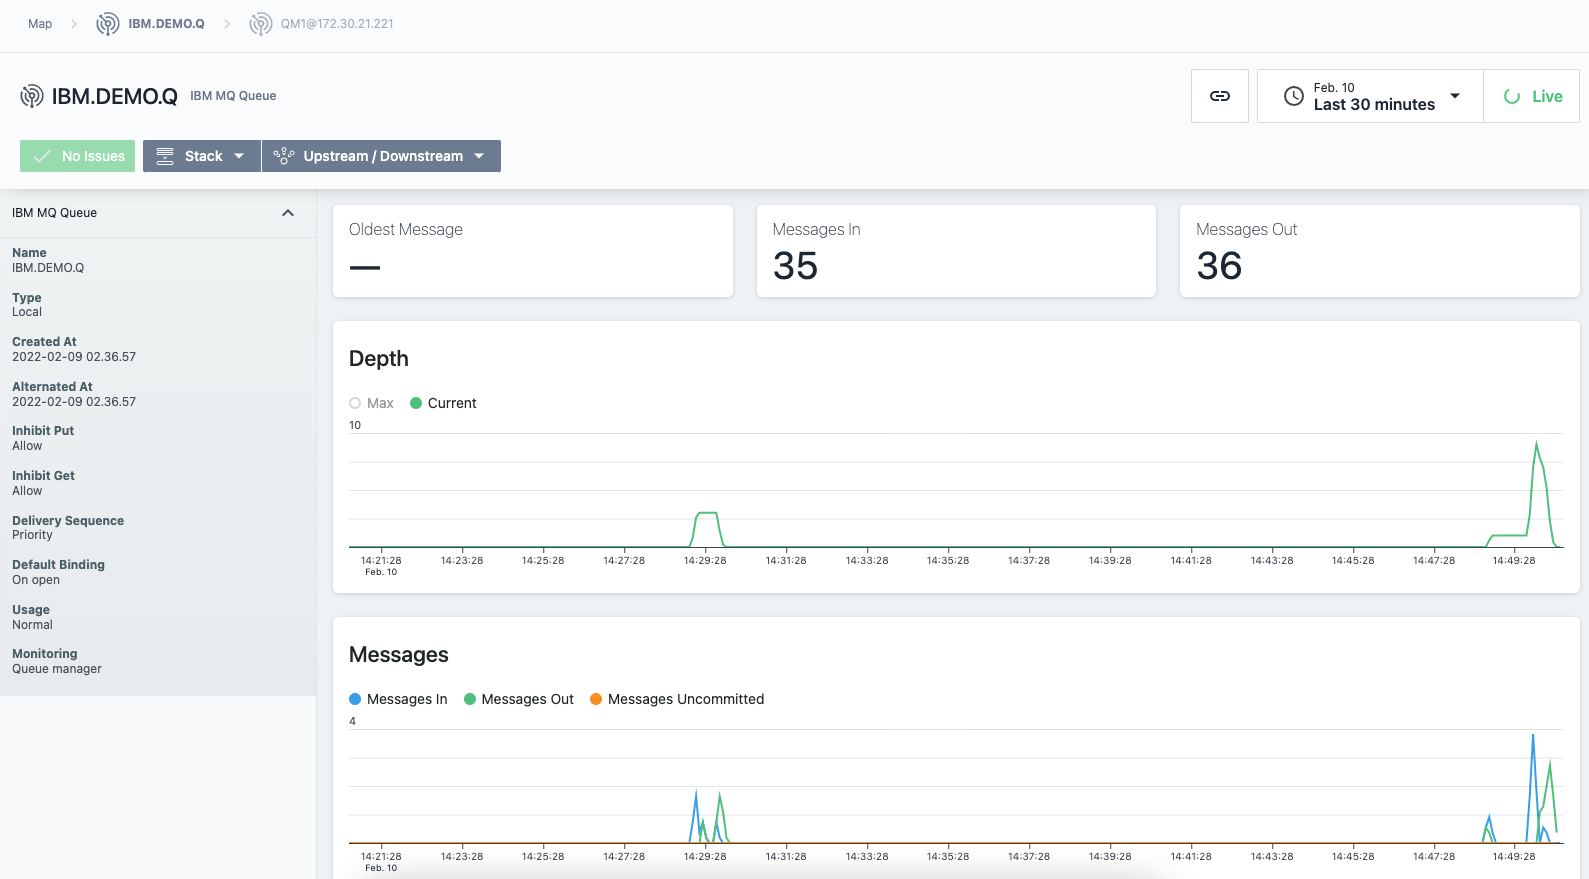
Congratulations!
You have completed this lab and seen how you can use Instana to monitor MQ queues.