Customizing dashboard
Overview
Audience: Architects, Application developers, Administrators
In this topic, we're going to:
- Access CP4I Grafana instance.
- Add a new panel to the existing MQ dashboard.
Introduction
In previous topics we have reviewed the monitoring stack and we have configured the system to ingest MQ standard metrics. On top of that, we have used an auxiliary application to extract more information from the queue manager and expose it As new metrics.
We are going to surface one of those new metrics, ibmmq_queue_depth, in the MQ dashboard provided with the instance. We will take this measure and we are going to build a gauge-type panel to show the depth of a queue.
Build gauge panel
-
Access CP4I Grafana Instance
As we have seen previously, Grafana instance provided by CP4I can be reached from Platform Navigator. Let's go to a terminal window to retrieve the URL from the Platform Navigator route:
Login into the Platform Navigator usingPN_URL=$(oc get route integration-navigator-pn -n tools -o jsonpath="{.spec.host}") echo "https://$PN_URL"adminuser and the password you can extract issuing the following command:oc -n ibm-common-services get secret platform-auth-idp-credentials -o jsonpath='{.data.admin_password}' | base64 -d && echoOn the left-hand side menu select the
Integration runtimesoption.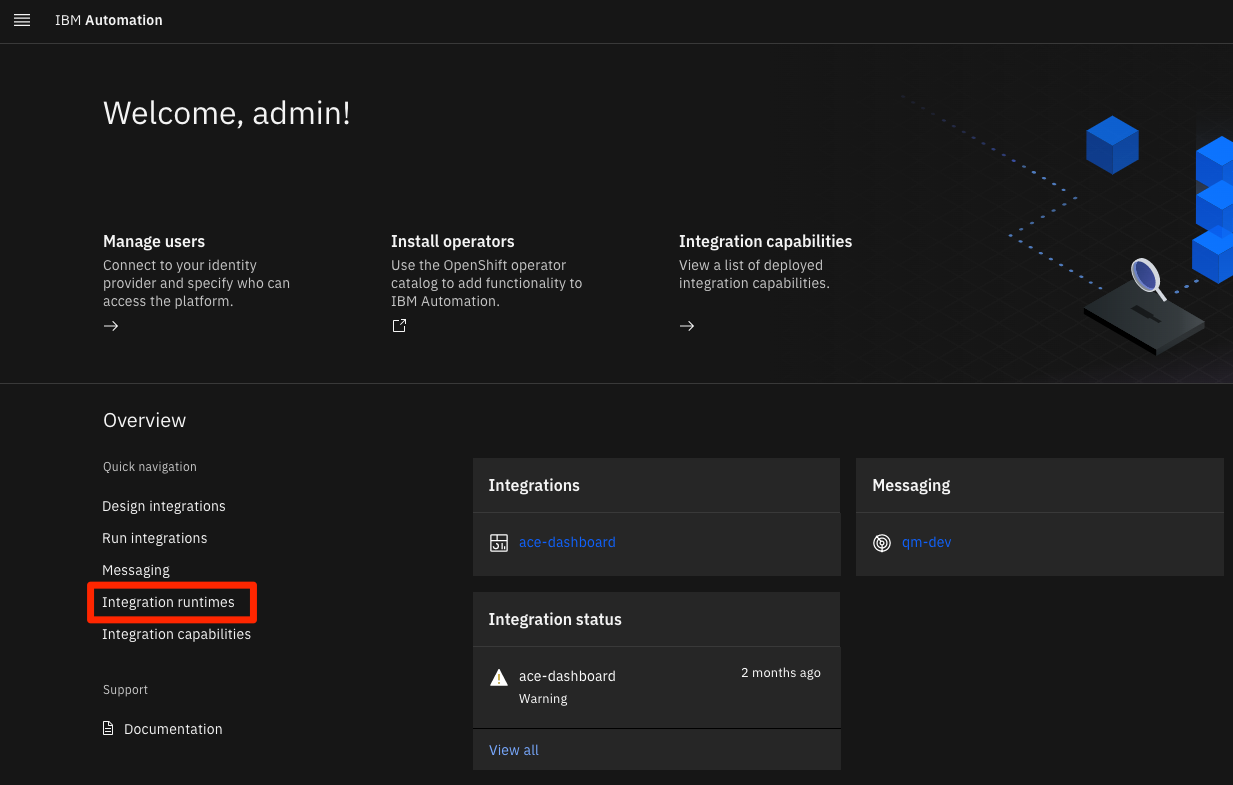
The screen then presents all the integration runtimes. Click on the three dots menu on the right hand side and select
Monitoringoption.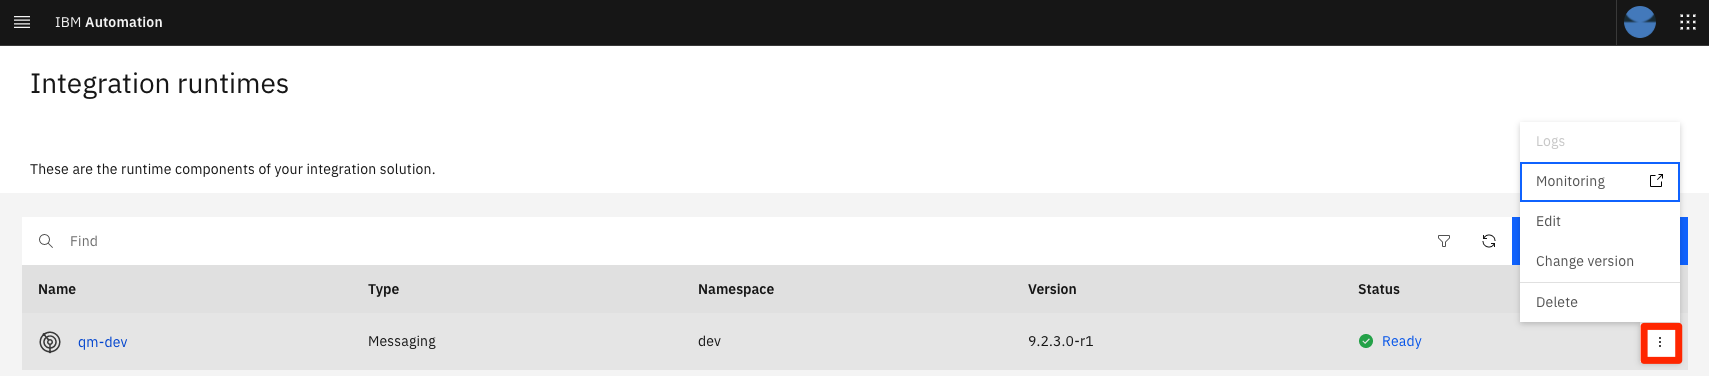
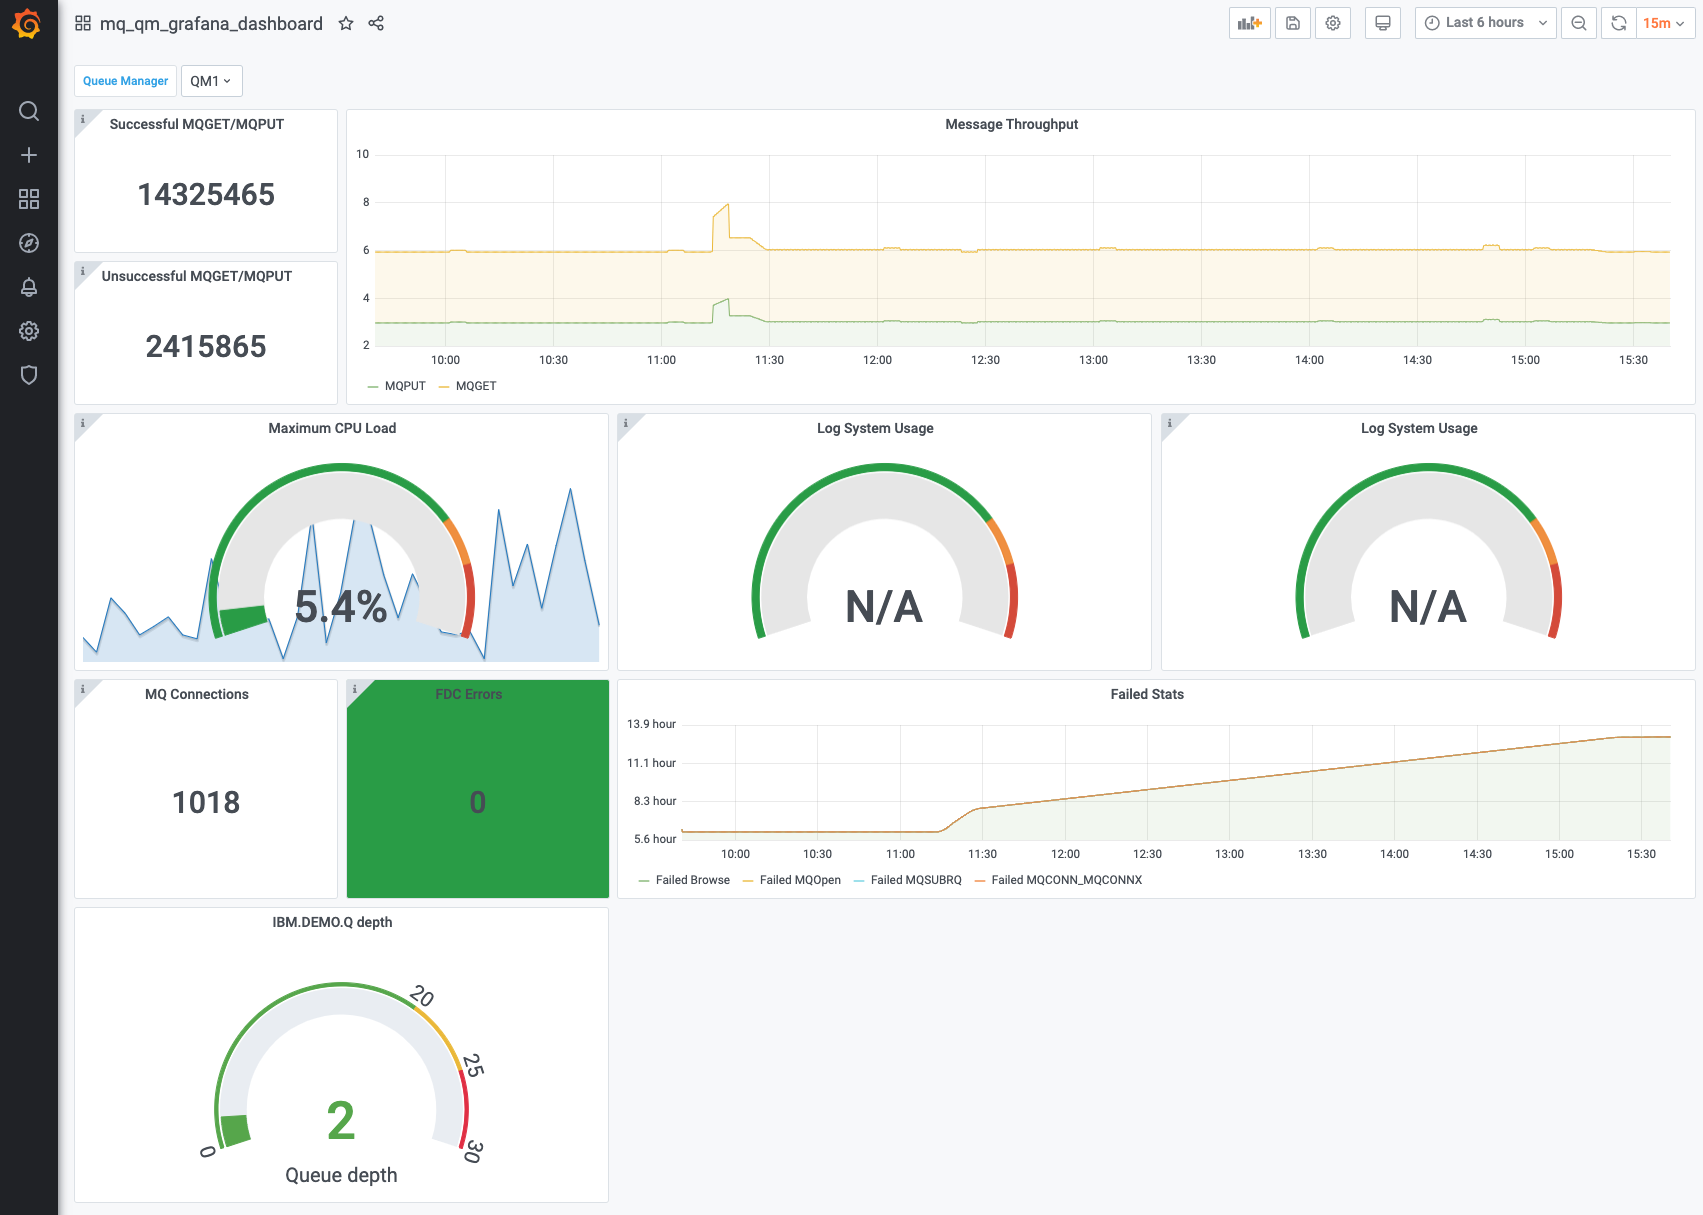
A new tab will open in the browser with the Grafana UI that we can use to configure our dashboard. Initially there is a default dashboard provided for MQ with several metrics and graphs.
-
Create a panel with queue depths
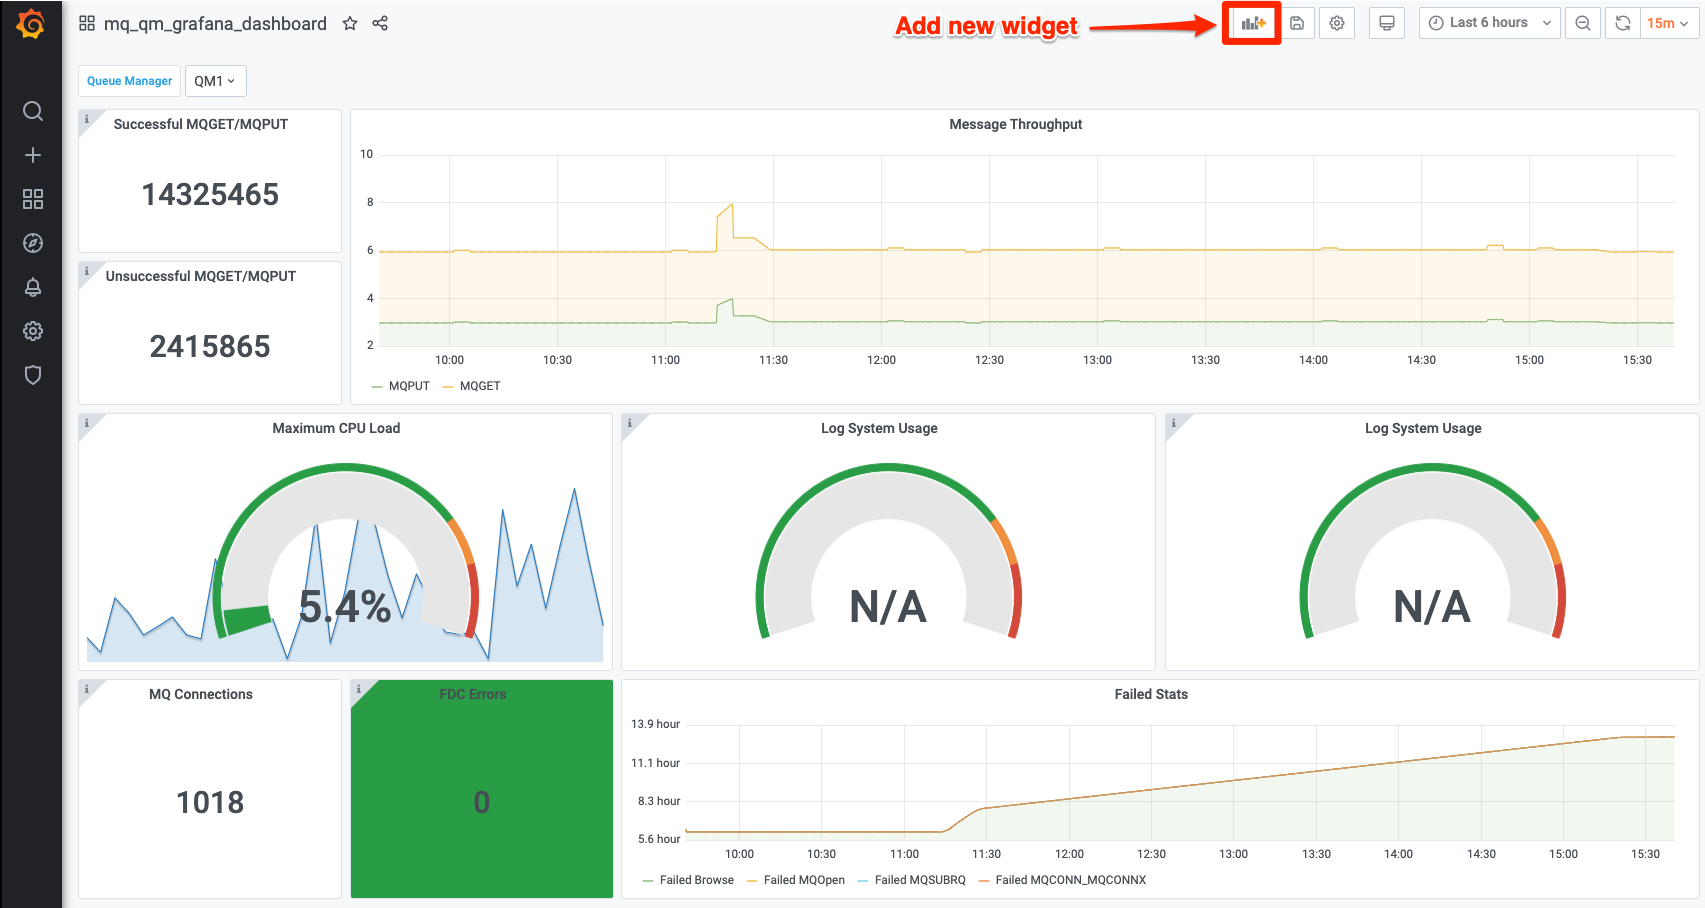
Click on the icon at the top of the screen to add a new panel.
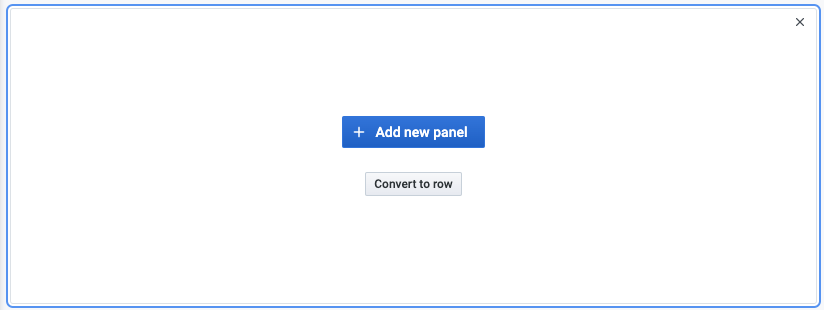
Click the
+ Add new panelbutton. A new screen will appear where we can start updating the different sections. -
Configure the panel
The central part is for the queries and graphical representation of the selected metrics. The right columns contains different sections to provide all the details to build our panel.
Let's start with the right column. In the first tab
Panelupdate theSettingssectionPanel titlefield with the textIBM.DEMO.Q depth.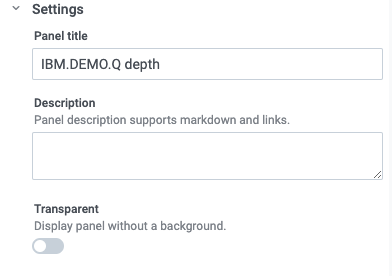
-
Choose the visualization
In
Visualizationsection, selectGaugetype.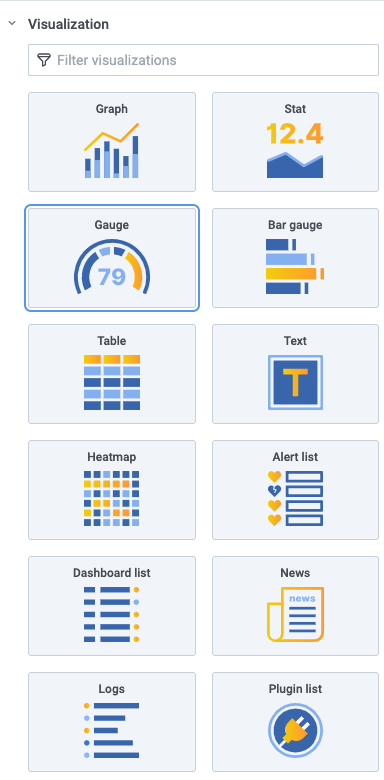
-
Configure data display
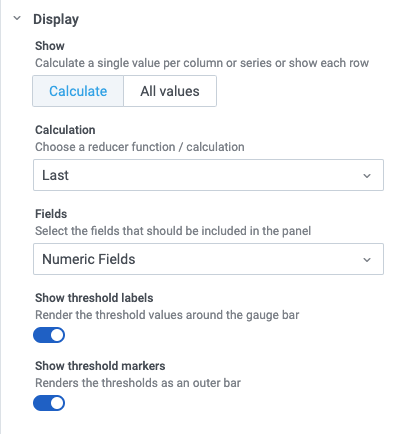
In
Displaysection select:- Show:
Calculate - Calculation:
Last - Fields:
Numeric Fields - Show threshold labels:
ON - Show threshold markers:
ON
- Show:
-
Configure standard options
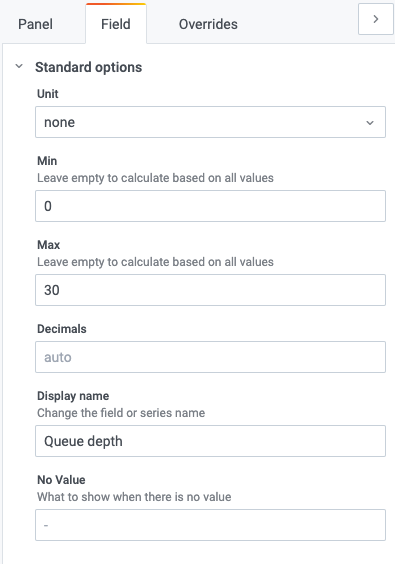
Let's switch now to the second tab
Field. In theStandard optionssection provide:- Unit:
Misc > none - Min:
0 - Max:
30(adapt this value according with the level of messages you are planning to have) - Display name:
Queue depth
- Unit:
-
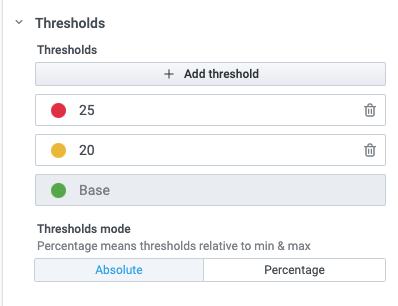
Set thresholds
In the
Thresholdssection we can set values to define different ranges in our representation. By default, only two thresholds are present defining the green (Base) and the red ranges (beyond the threshold). Add a new one to have a yellow range. Provide the thresholds:- Yellow:
20 - Red:
25
Again, adapt the values to the right numbers depending on the amount of messages you are expecting to have so the green area represents operation in normal ranges, yellow range represents a warning zone and the red one a danger zone.
- Yellow:
-
Set the query
Finally we need to provide the query in the main area of the screen.
- Select
prometheusas the source of data in the dropdown list. - Provide
ibmmq_queue_depth{queue="IBM.DEMO.Q",qmgr="QM1"}as query. - Set the legend to
Queue depth.
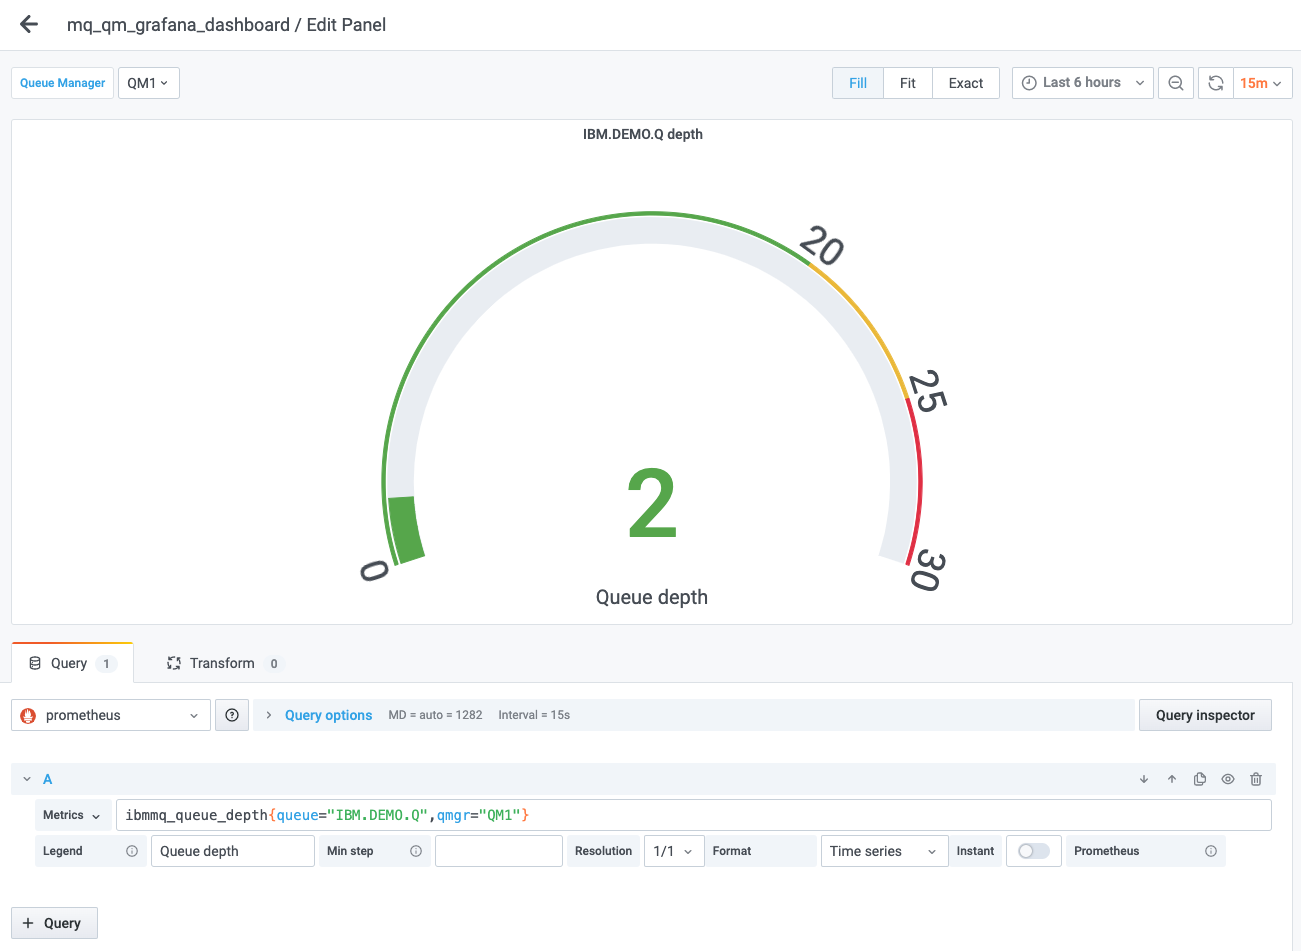
- Select
-
Save the panel
We have finished the configuration of the new panel.
Press the
Applybutton located at the top right corner. This will return us to the dashboard view with our new panel configured.Save the dashboard using the floppy disk icon located on the right of the new panel icon we used to create the new panel. Confirm clicking
Savein the pop-up window that appears. -
Organize the dashboard
You can resize the panel with the anchor that appears in the bottom right corner when you hover with the mouse.
You can also drag and drop the panel with the anchor that appears when hover the panel title. The panels will relocate trying to fill an invisible grid. Just remember to save the changes when you finish making changes.
-
Create messages
Only remains to go to the MQ console and add some messages to the
IBM.DEMO.Qqueue. Then check the dashboard to verify that the gauge is reflecting the new queue depth.
Congratulations!
You've now created a panel that represents one of the new metrics exposed by the auxiliary metrics application. You have now the tools to extend this dashboard to your needs or create alternative ones that represent the measures of interest for your use cases.