Metrics application
Overview
Audience: Architects, Application developers, Administrators
In this topic, we're going to:
- Revisit our monitoring scenario.
- Prepare and configure a new application to surface more metrics.
- Deploy the application.
- Verify we can see new metrics in Prometheus.
Introduction
We have now metrics flowing from our queue manager to Prometheus. But those are the metrics that MQ exposes by default. In some scenarios we would be interested in other metrics beyond the default set. For example, queue depth is an interesting one that many MQ admins look for.
In such scenarios we need an auxiliary application. This new application is, in simple terms, an MQ client that connects to our queue manager, retrieves the information of interest, process it and expose it in a metrics endpoint with the right format so Prometheus can read them.
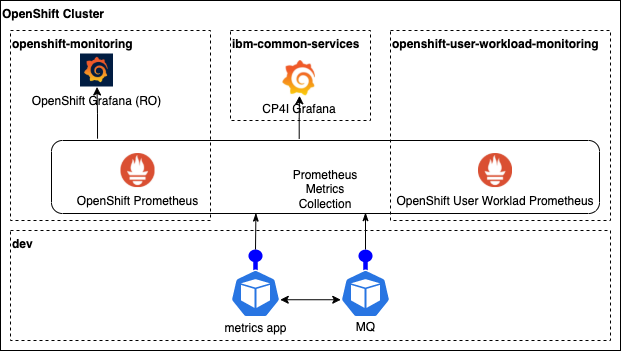
In this topic we are going to review this new application and we are going to deploy it so we can start seeing the new metrics in Prometheus.
Creating metrics app repo
-
Ensure environment variables are set
Tip
Ensure you're in the multi-tenancy-gitops-apps terminal window.
Tip
If you're returning to the tutorial after restarting your computer, ensure that the
$GIT_ORG,$GIT_BRANCHand$GIT_ROOTenvironment variables are set.(Replace
appropriately:) export GIT_BRANCH=master export GIT_ORG=<your organization name> export GIT_ROOT=$HOME/git/$GIT_ORG-rootYou can verify your environment variables as follows:
echo $GIT_BRANCH echo $GIT_ORG echo $GIT_ROOT -
Ensure you're logged in to the cluster
Log into your OCP cluster, substituting the --token and --server parameters with your values:
oc login --token=<token> --server=<server>If you are unsure of these values, click your user ID in the OpenShift web console and select "Copy Login Command".
-
Go to your root folder
In the terminal let's move to our root folder:
cd $GIT_ROOT -
Fork mq-metric-samples application repository
Navigate to the
mq-metric-samplesrepository that can be found in theibm-messagingorganization at https://github.com/ibm-messaging/mq-metric-samples and fork it into your organization. -
Clone the fork to your local machine
git clone https://github.com/$GIT_ORG/mq-metric-samples.git -
Change to the local clone's folder
cd mq-metric-samples -
Review the application source directories
tree -L 1The following diagram shows the directory structure for the metrics application:
.
├── CHANGELOG.md
├── CLA.md
├── Dockerfile.build
├── Dockerfile.run
├── LICENSE
├── README.md
├── cmd
├── config.common.yaml
├── cp4i
├── dspmqrtj
├── go.mod
├── go.sum
├── pkg
├── scripts
└── vendor
This repository contains a collection of IBM MQ monitoring agents that utilize the IBM MQ golang metric packages to provide programs that can be used with existing monitoring technologies such as Prometheus, AWS CloudWatch, etc.
In this structure note the following folders:
cmdcontains the different code bases for different solutions. The case of interest here ismq_prometheusthat will perform the export of queue manager data into a Prometheus data set.cp4icontains yaml resources and helm charts that will help us to deploy the application in our cluster.scriptscontains functionality that will help to build the container images on our local environments.
-
Review the ConfigMap template
Let's have a look to the ConfigMap template. The ConfigMap that is provided contains all the parameters that the metrics application is going to use to connect to the queue manager. Issue the following command to check the template:
cat cp4i/chart/base/templates/configmap.yamlYou will see the following output:
apiVersion: v1
kind: ConfigMap
metadata:
name: {{ .Values.name }}
data:
IBMMQ_CONNECTION_QUEUEMANAGER: {{ .Values.configmap.QM | quote }}
IBMMQ_CONNECTION_CONNNAME: {{ .Values.configmap.CONNECTION_NAME | quote }}
IBMMQ_CONNECTION_CHANNEL: {{ .Values.configmap.CHANNEL | quote }}
IBMMQ_OBJECTS_QUEUES: {{ .Values.configmap.QUEUES | quote }}
IBMMQ_OBJECTS_SUBSCRIPTIONS: {{ .Values.configmap.SUBSCRIPTIONS | quote }}
IBMMQ_OBJECTS_TOPICS: {{ .Values.configmap.TOPICS | quote }}
IBMMQ_GLOBAL_USEPUBLICATIONS: {{ .Values.configmap.USE_PUBLICATIONS | quote }}
IBMMQ_GLOBAL_USEOBJECTSTATUS: {{ .Values.configmap.USE_OBJECT_STATUS | quote }}
IBMMQ_GLOBAL_CONFIGURATIONFILE: {{ .Values.configmap.CONFIGURATION_FILE | quote }}
IBMMQ_GLOBAL_LOGLEVEL: {{ .Values.configmap.LOG_LEVEL | quote }}
We can see here the
CONNECTION_NAMEthat is using the service string to establish the connection and it is going to useMONITORING_CHLchannel to connect. -
Update values
Let's have a look to the
values.yamlthat will be used with the Helm templates:cat cp4i/chart/base/values.yamlWe will focus in the values for the ConfigMap. If we check at the end of the output, we will see the default values for the Config Map:
...
configmap:
  QM: "QM1"
  CONNECTION_NAME: "qm-dev-ibm-mq.dev.svc.cluster.local(1414)"
  CHANNEL: "MONITORING_CHL"
  QUEUES: "!SYSTEM.*,!AMQ.*,*"
  SUBSCRIPTIONS: "!$SYS*"
  TOPICS: "!*"
  USE_PUBLICATIONS: false
  USE_OBJECT_STATUS: true
  CONFIGURATION_FILE: ""
  LOG_LEVEL: "INFO"
We need to ensure the
CONNECTION_NAMEis correct for our cluster and we need to get theNameof the service so we can update the configuration. In our case this isqm1-ibm-mqso we will update thevalues.yamlfile to have the following:... configmap: QM: "QM1" CONNECTION_NAME: "qm1-ibm-mq.dev.svc.cluster.local(1414)" CHANNEL: "MONITORING_CHL" QUEUES: "!SYSTEM.*,!AMQ.*,*" SUBSCRIPTIONS: "!$SYS*" TOPICS: "!*" USE_PUBLICATIONS: false USE_OBJECT_STATUS: true CONFIGURATION_FILE: "" LOG_LEVEL: "INFO" -
Commit and push the changes
git add .
git commit -s -m "Update connection name"
git push origin $GIT_BRANCH
We have now the metrics application ready.
Prepare Queue Manager
Now we need to get our queue manager ready. In the previous section we saw that MONITORING_CHL channel was going to be used by the metrics app to connect to our queue manager. We need to update config.mqsc to make this channel available.
-
Ensure environment variables are set
Tip
Ensure that the
$GIT_BRANCH_QM1environment variable is set.export GIT_BRANCH_QM1=qm1-$GIT_ORGYou can verify your environment variable as follows:
echo $GIT_BRANCH_QM1 -
Go to your
mq-infrarepoSwitch now to the terminal where you are working with
mq-infrarepository and ensure you are in the correct folder:cd $GIT_ROOT/mq-infra -
Switch to $GIT_BRANCH_QM1
We are about to make an update in MQSC configuration, so we will work in the branch we created during the building of the queue manager.
git checkout $GIT_BRANCH_QM1 -
Update
config.mqscThe
config.mqscis located atchart/base/config/config.mqscand it already contains the configurations needed for monitoring purposes. Uncomment the lines that define theMONITORING_CHLand the security for it removing the*characters.DEFINE QLOCAL(IBM.DEMO.Q) BOQNAME(IBM.DEMO.Q.BOQ) BOTHRESH(3) REPLACE DEFINE QLOCAL(IBM.DEMO.Q.BOQ) REPLACE * Use a different dead letter queue, for undeliverable messages DEFINE QLOCAL('DEV.DEAD.LETTER.QUEUE') REPLACE ALTER QMGR DEADQ('DEV.DEAD.LETTER.QUEUE') DEFINE CHANNEL('IBM.APP.SVRCONN') CHLTYPE(SVRCONN) ALTER QMGR CHLAUTH (DISABLED) * DEFINE CHANNEL('MONITORING_CHL') CHLTYPE(SVRCONN) * SET CHLAUTH(MONITORING_CHL) TYPE(BLOCKUSER) USERLIST(NOBODY) REFRESH SECURITY TYPE(CONNAUTH) -
Push the changes
The configuration is ready and we need to get it into our Git repo.
git add . git commit -s -m "Enable monitoring channel" git push origin $GIT_BRANCH_QM1 -
Check
mq-infra-devpipeline is runningIf you have setup the webhooks for the
mq-infrarepository following the Continuous updates topic, a new pipeline run is running now. If you skipped that section, you will need to trigger a new run manually.Once the pipeline finishes and the new version of the queue manager is deployed, verify the new channel is available. Access the MQ console and in the
Communicationtab,App channelssection, you will see theMONITORING_CHLlisted.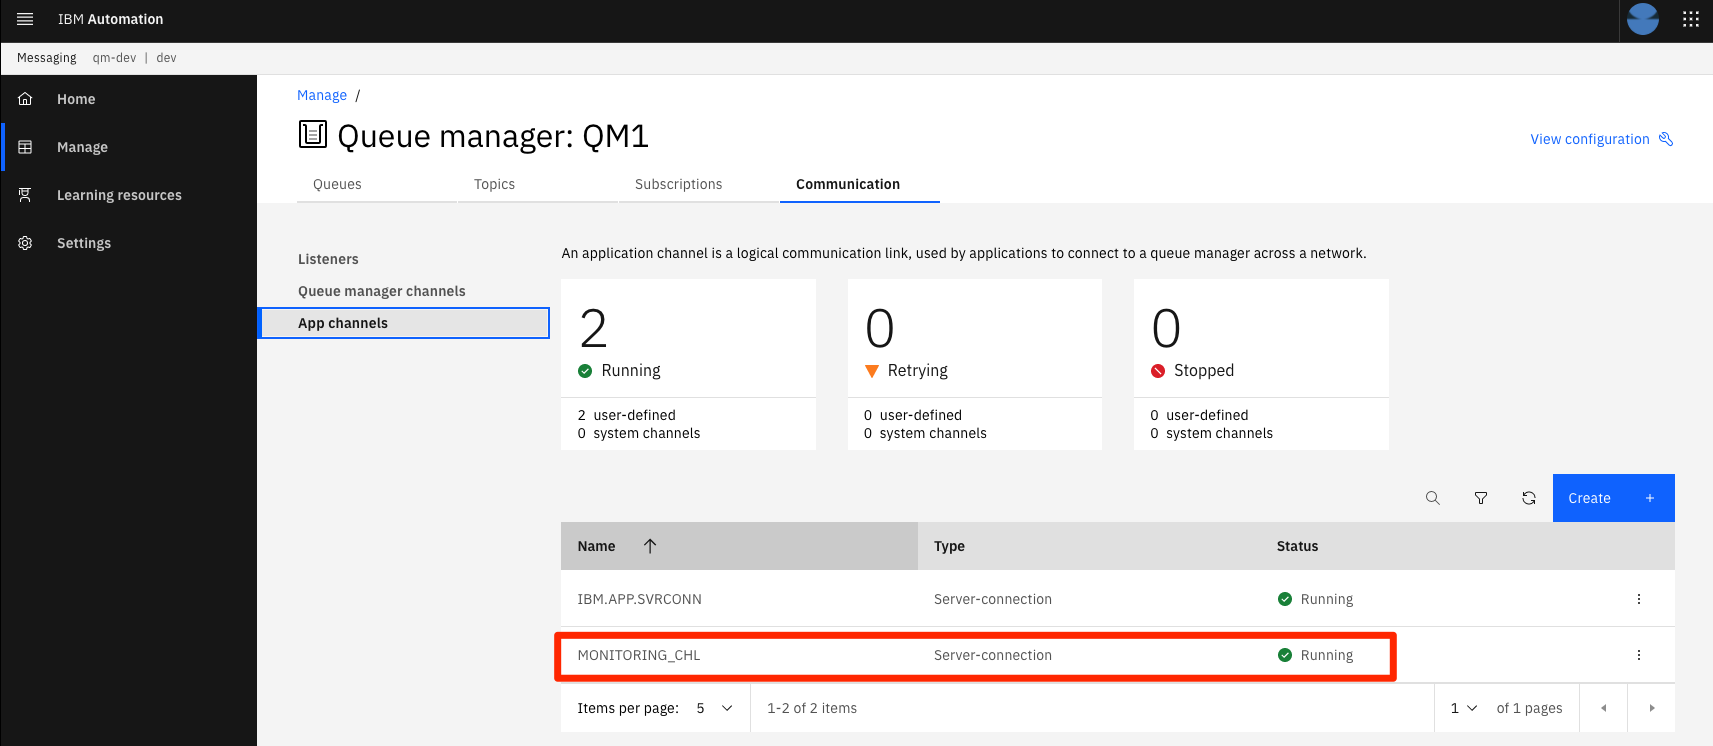
Enable CI resources
Let's now enable and review the application pipeline and a task that will build our metrics app image in the pipeline.
-
Go to
multi-tenancy-gitops-appsfolderFor this section, we return to the terminal window we used in previous chapters for interacting with the GitOps repository. Open a new terminal window for the
multi-tenancy-gitops-appsrepository if necessary.cd $GIT_ROOT/multi-tenancy-gitops-apps -
Check the resources
In this repo there are a pipeline and a task resources that we will use to deploy our metrics application:
- The pipeline resource is defined in
mq/environments/ci/pipelines/mq-metric-samples-dev-pipeline.yaml - The task resource is defined in
mq/environments/ci/tasks/mq-metrics-build-tag-push.yaml
Feel free to review these resources in depth.
- The pipeline resource is defined in
-
Update kustomize
We need to get those resources deployed in our cluster. We just need to uncomment the highlighted lines in
mq/environments/ci/kustomization.yamlso ArgoCD can deploy them.resources: #- certificates/ci-mq-client-certificate.yaml #- certificates/ci-mq-server-certificate.yaml - configmaps/gitops-repo-configmap.yaml - eventlisteners/cntk-event-listener.yaml - triggerbindings/cntk-binding.yaml - triggertemplates/mq-infra-dev.yaml - triggertemplates/mq-spring-app-dev.yaml #- pipelines/mq-metric-samples-dev-pipeline.yaml - pipelines/ibm-test-pipeline-for-dev.yaml - pipelines/ibm-test-pipeline-for-stage.yaml #- pipelines/java-maven-dev-pipeline.yaml - pipelines/mq-pipeline-dev.yaml - pipelines/mq-spring-app-dev-pipeline.yaml - roles/custom-pipeline-sa-clusterrole.yaml - roles/custom-pipeline-sa-role.yaml - roles/custom-ci-pipeline-sa-rolebinding.yaml - roles/custom-dev-pipeline-sa-rolebinding.yaml - roles/custom-staging-pipeline-sa-rolebinding.yaml - roles/custom-prod-pipeline-sa-rolebinding.yaml - routes/cntk-route.yaml - secrets/artifactory-access-secret.yaml - secrets/git-credentials-secret.yaml - secrets/ibm-entitled-registry-credentials-secret.yaml #- secrets/mq-client-jks-password-secret.yaml - tasks/10-gitops.yaml - tasks/10-gitops-for-mq.yaml - tasks/10-gitops-promotion.yaml - tasks/11-app-name.yaml - tasks/12-functional-tests.yaml - tasks/13-jmeter-performance-test.yaml - tasks/13-cphtestp-performance-test.yaml - tasks/4-smoke-tests-mq.yaml - tasks/4-smoke-tests.yaml - tasks/ibm-build-tag-push-v2-6-13.yaml - tasks/ibm-helm-release-v2-6-13.yaml - tasks/ibm-img-release-v2-6-13.yaml - tasks/ibm-img-scan-v2-6-13.yaml - tasks/ibm-java-maven-test-v2-6-13.yaml - tasks/ibm-setup-v2-6-13.yaml - tasks/ibm-tag-release-v2-6-13.yaml #- tasks/mq-metrics-build-tag-push.yaml # Automated promotion process triggers - triggertemplates/mq-infra-dev-triggertemplate.yaml - eventlisteners/mq-infra-dev-eventlistener.yaml - routes/mq-infra-dev-route.yaml - triggertemplates/mq-spring-app-dev-triggertemplate.yaml - eventlisteners/mq-spring-app-dev-eventlistener.yaml - routes/mq-spring-app-dev-route.yaml - triggertemplates/mq-infra-stage-triggertemplate.yaml - eventlisteners/mq-infra-stage-eventlistener.yaml - routes/mq-infra-stage-route.yaml - triggertemplates/mq-spring-app-stage-triggertemplate.yaml - eventlisteners/mq-spring-app-stage-eventlistener.yaml - routes/mq-spring-app-stage-route.yaml -
Push the changes
With those lines uncommented, push the changes:
git add .
git commit -s -m "Enable monitoring application pipeline and build task"
git push origin $GIT_BRANCH
Wait until ArgoCD deploys them. You can check how the new resources appear in the
apps-mq-rest-ci-1ArgoCD application.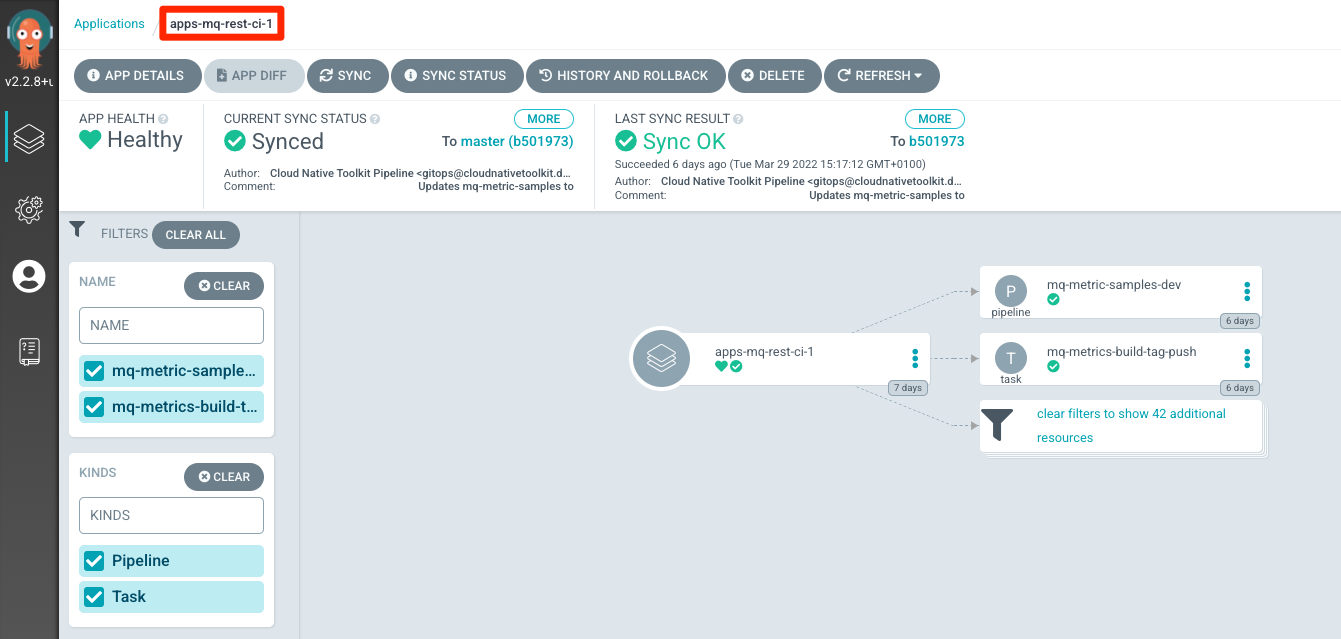
Build and deploy app
The pipeline to build the metrics application is now available in OpenShift. We are going to run it to obtain the image that will be deployed by ArgoCD.
-
Review the pre-configured pipeline
Open the OpenShift console and navigate to
Pipelines > Pipelines.You will want to select the
ciProject from the dropdown at the top of the page.Click the
mq-metric-samples-devPipeline to view the metrics application build pipeline.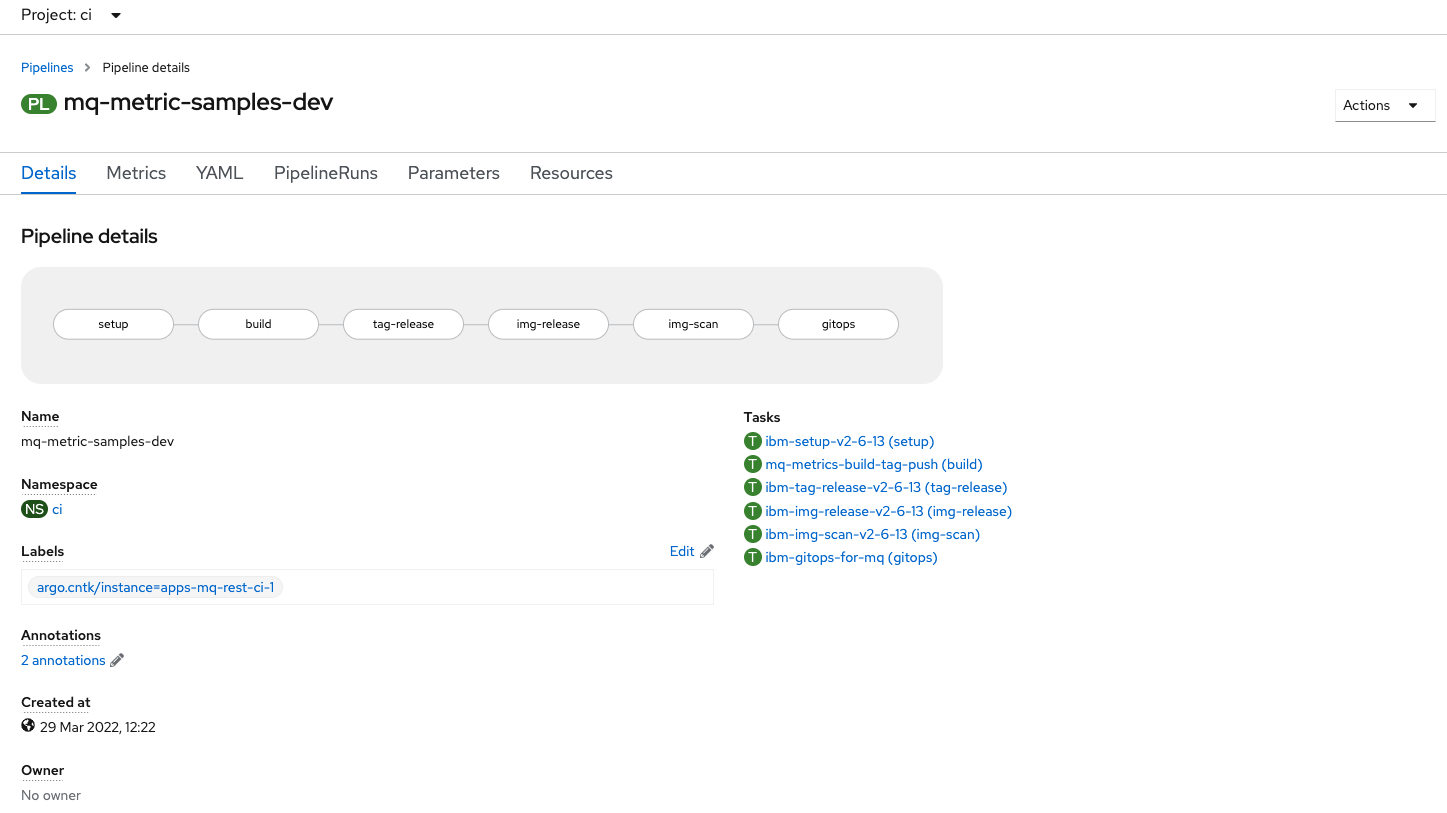
The code is checked out and then a build task uses the code to compile the application and embed it into a container image. Then the code is tagged and the image released. Finally, the
multi-tenancy-gitops-appsrepository is updated to reflect the new desired estate. -
Kickoff a pipeline run
From the Actions dropdown menu in the upper-right corner, select Start.
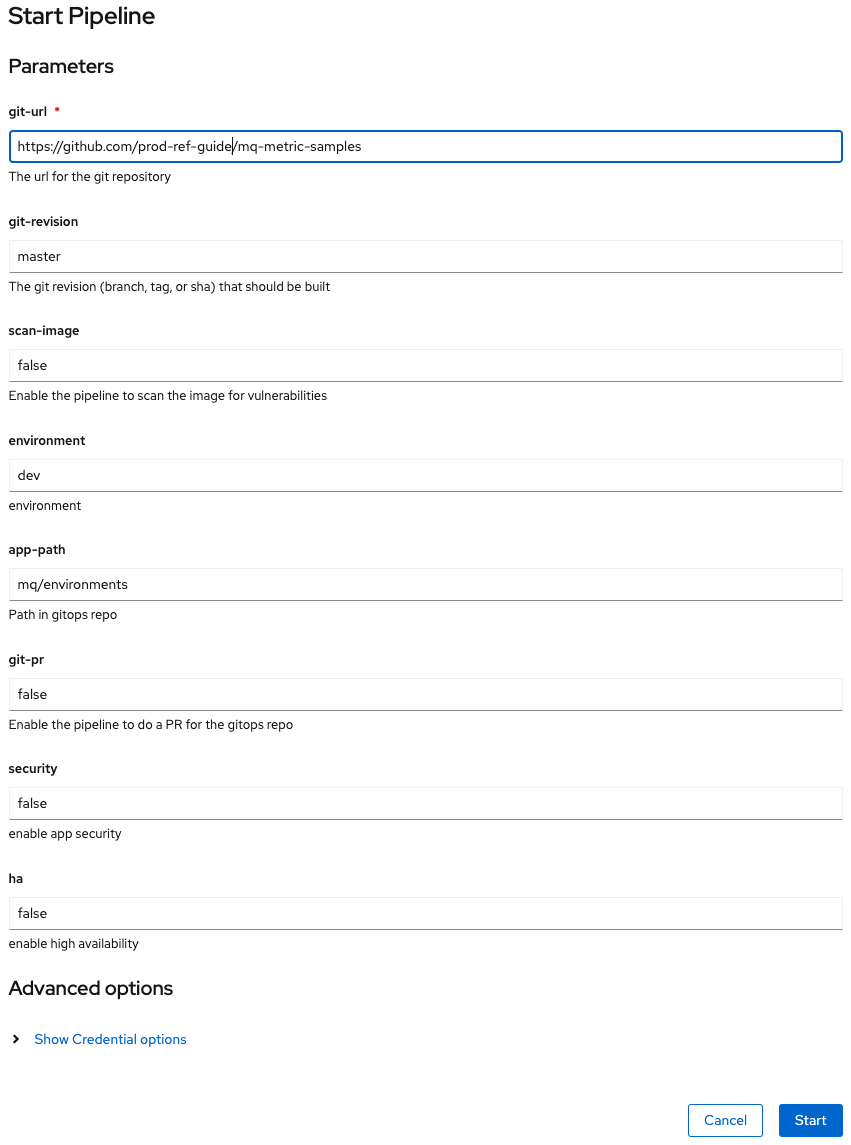
Configure the run as follows:
- Set
git-urlto your fork of themq-metric-samplesrepository - Set
git-revisiontomaster. - Set
scan-image: false(temporary fix while issues with UBI are resolved)
Click Start and wait! Keep checking until all steps have completed.
- Set
-
Re-merging local clone to view updated app resources in GitOps repository
The
mq-metric-samples-devpipeline run updated the GitOps repository with the application kubernetes resources. This means that our local clone of the GitOps repository is one commit behind GitHub. Before we can push any more changes to the GitOps repository, we must re-merge our local clone with GitHub.Return to the terminal window you're using for the
multi-tenancy-gitops-appsGitOps apps repository. (Rather than the terminal window you're using for themq-metric-samplessource repository.)git fetch origin git merge origin/$GIT_BRANCHwhich shows that
Updating e3a855d..3b9a70d
Fast-forward
mq/environments/mq-metric-samples/overlays/dev/mq-metric-samples/configmap.yaml      | 17 +++++++++++++++++
mq/environments/mq-metric-samples/overlays/dev/mq-metric-samples/deployment.yaml     | 40 ++++++++++++++++++++++++++++++++++++++++
mq/environments/mq-metric-samples/overlays/dev/mq-metric-samples/role.yaml           | 10 ++++++++++
mq/environments/mq-metric-samples/overlays/dev/mq-metric-samples/rolebinding.yaml    | 13 +++++++++++++
mq/environments/mq-metric-samples/overlays/dev/mq-metric-samples/route.yaml          | 16 ++++++++++++++++
mq/environments/mq-metric-samples/overlays/dev/mq-metric-samples/secret.yaml         | 10 ++++++++++
mq/environments/mq-metric-samples/overlays/dev/mq-metric-samples/service.yaml        | 24 ++++++++++++++++++++++++
mq/environments/mq-metric-samples/overlays/dev/mq-metric-samples/serviceaccount.yaml |  6 ++++++
mq/environments/mq-metric-samples/overlays/dev/mq-metric-samples/servicemonitor.yaml | 19 +++++++++++++++++++
9 files changed, 155 insertions(+)
create mode 100644 mq/environments/mq-metric-samples/overlays/dev/mq-metric-samples/configmap.yaml
create mode 100644 mq/environments/mq-metric-samples/overlays/dev/mq-metric-samples/deployment.yaml
create mode 100644 mq/environments/mq-metric-samples/overlays/dev/mq-metric-samples/role.yaml
create mode 100644 mq/environments/mq-metric-samples/overlays/dev/mq-metric-samples/rolebinding.yaml
create mode 100644 mq/environments/mq-metric-samples/overlays/dev/mq-metric-samples/route.yaml
create mode 100644 mq/environments/mq-metric-samples/overlays/dev/mq-metric-samples/secret.yaml
create mode 100644 mq/environments/mq-metric-samples/overlays/dev/mq-metric-samples/service.yaml
create mode 100644 mq/environments/mq-metric-samples/overlays/dev/mq-metric-samples/serviceaccount.yaml
create mode 100644 mq/environments/mq-metric-samples/overlays/dev/mq-metric-samples/servicemonitor.yaml
We're now in a consistent state with the GitOps apps repository.
-
The ArgoCD application for
MQ metric samples applicationMQ metric samples applicationhas its deployment to the cluster managed by a dedicated ArgoCD application calleddev-mq-metric-samples-instance. This follows the separation of concerns pattern where one ArgoCD application manages a set of related Kubernetes resources deployed to a cluster; in this case, all those resources associated withMQ metric samples applicationin thedevnamespace.Issue the following command to show the ArgoCD application details:
cat mq/config/argocd/dev/dev-mq-metric-samples-instance.yamlwhich shows a YAML file typical of those we've seen before:
apiVersion: argoproj.io/v1alpha1
kind: Application
metadata:
name: dev-mq-metric-samples-instance
annotations:
  argocd.argoproj.io/sync-wave: "300"
finalizers:
  - resources-finalizer.argocd.argoproj.io
spec:
destination:
  namespace: dev
  server: https://kubernetes.default.svc
project: applications
source:
  path: mq/environments/mq-metric-samples/overlays/dev
  repoURL: https://github.com/cloud-native-toolkit-demos/multi-tenancy-gitops-apps.git
  targetRevision: master
syncPolicy:
  automated:
    prune: true
    selfHeal: true
See how the application resources are referenced by
path: mq/environments/mq-metric-samples/overlays/dev:mq/environments/mq-metric-samples/overlays/dev/ ├── configmap │ └── configmap.yaml ├── kustomization.yaml └── mq-metric-samplesThe ArgoCD application applies these resources to the cluster to instantiate
MQ metric samples applicationas a set of cluster resources. -
Look at active
MQ metric samples applicationArgoCD applicationLet's examine
MQ metric samples applicationand its Kubernetes resources using the ArgoCD UI.In the ArgoCD UI search the Applications view with the keyword
mq-metric-samples:(You may need to launch the ArgoCD UI again. Refer to these instructions.)
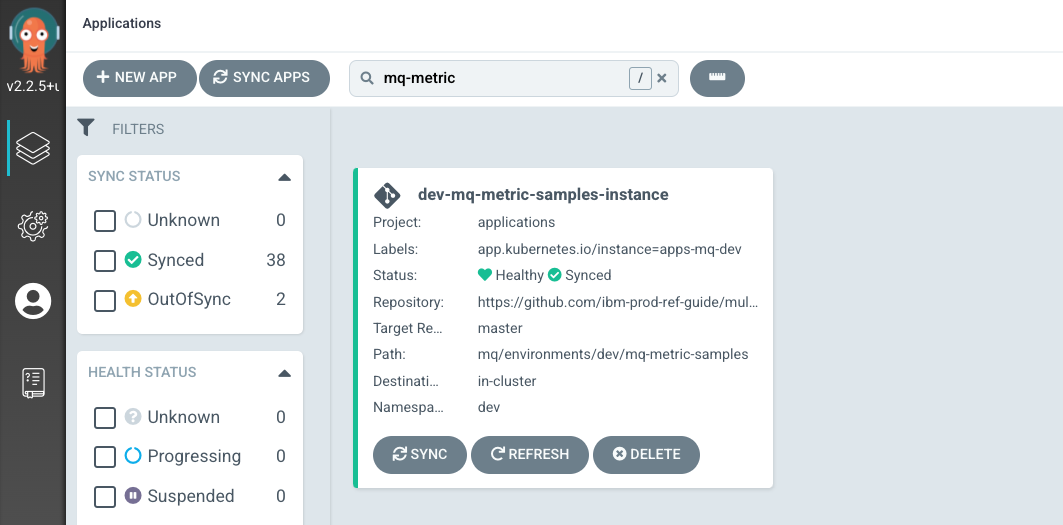
We can now see the below ArgoCD Application:
- A new
dev-mq-metric-samples-instanceArgoCD application that is managingmq-metric-samplesresources deployed to the cluster.
Metrics application configuration still not finished
At this moment the application is deployed but not healthy. This is expected. Continue with the last two steps to finish the configuration.
- A new
-
Give permissions to service account
As part of the set of resources deployed, the application runs as a service account
mq-metric-samples. At this moment the pod is not capable to run due to lack of permissions and we need to provide them issuing the following command:oc adm policy add-scc-to-user anyuid -z mq-metric-samples -n devFirst iteration
Take into account that this is the first iteration for the MQ monitoring where security aspects has not been addressed yet.
-
Check permissions
Now issue the following command to check if the pod is allowed by
anyuid. Make sure you use the right name for the pod as this name contains a component that is randomized, so it will be different from the one reflected here:oc get pod mq-metric-samples-6545f985f-6jjr8-o yaml | oc adm policy scc-subject-review -f -You should see the following output:
RESOURCE ALLOWED BY Pod/mq-metric-samples-6545f985f-6jjr8 anyuid -
Reboot the pod
Now that the service account has the permissions issued, let's remove the pod to trigger its recreation so the new pod will run under the new permission we gave in the previous steps.
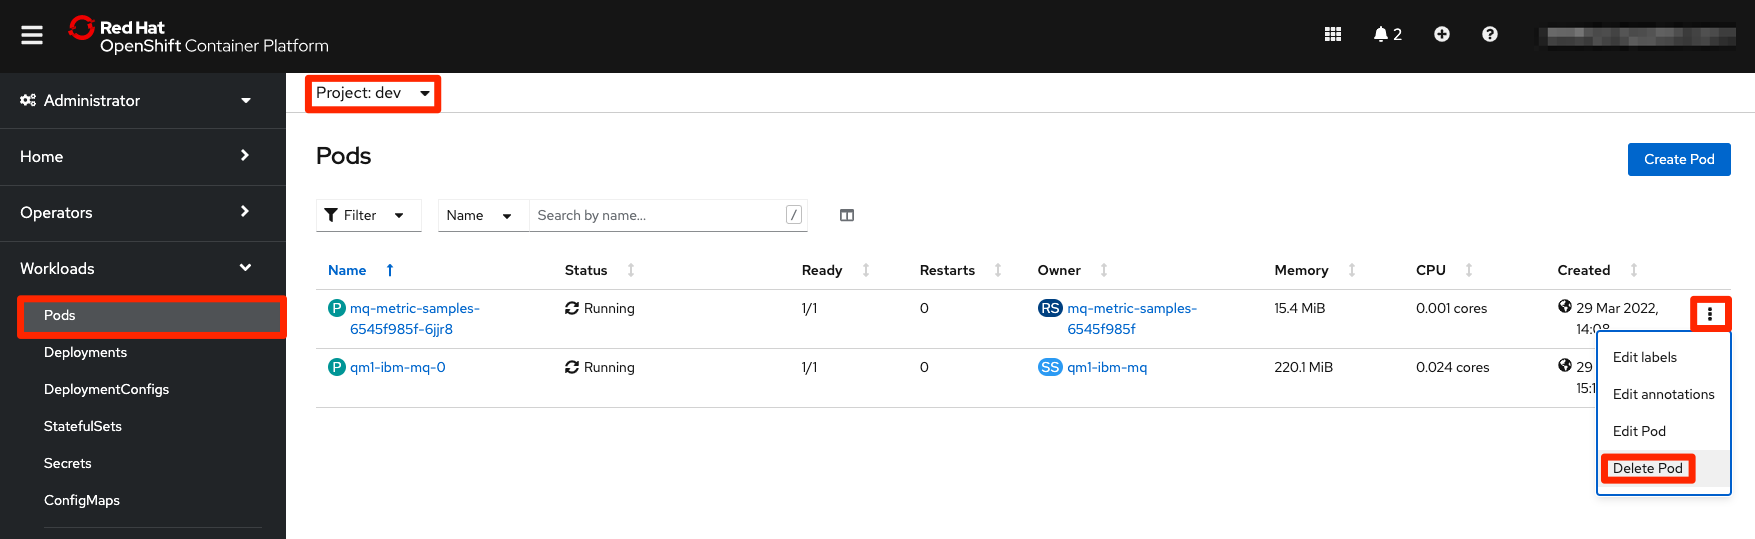
Go to the OpenShift web console. Access
Workloads > Podssection on the left menu and ensure you are in thedevproject. You will see the metrics app pod. Click on the three dots menu on the right-hand side and selectDelete Pod. Immediately a new pod will be created and the new pod now shows as Running. -
View the new
MQ metric samples applicationKubernetes resourcesBack to ArgoCD UI, we can look at the deployed instance of
mq-metric-samplesand its dependent kubernetes resources.Click on the
dev-mq-metric-samples-instanceArgoCD application: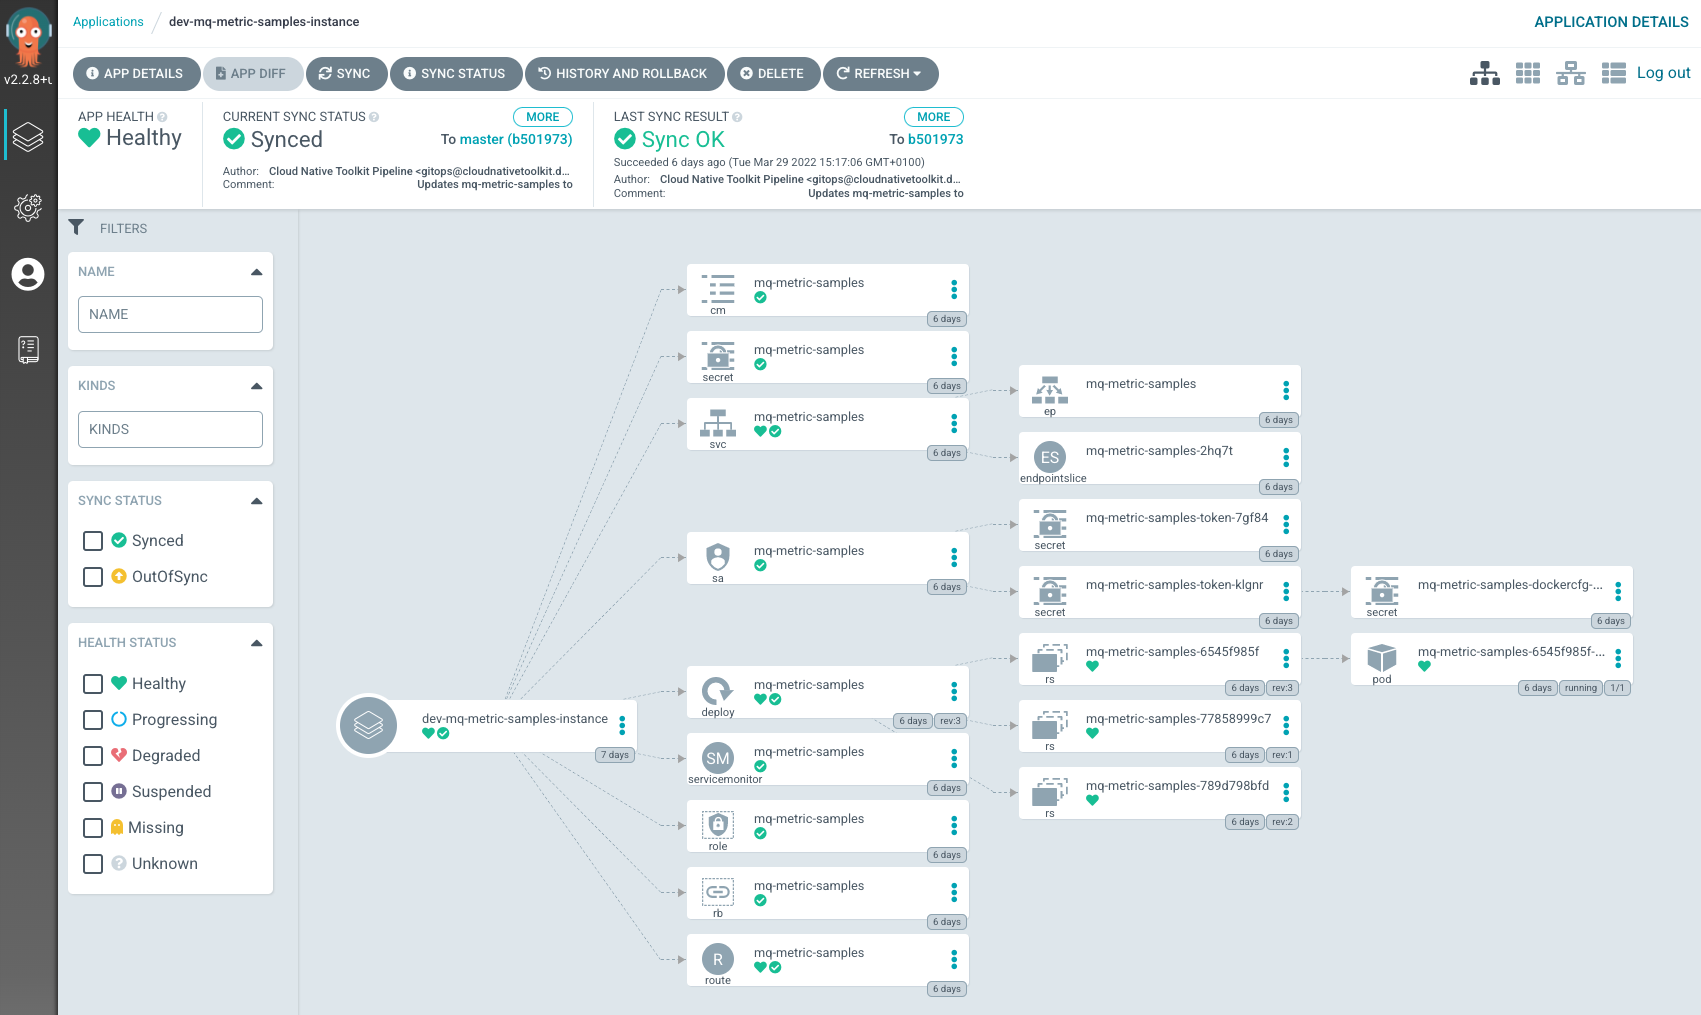
Verify app deployment
-
Review the deployed application
The application is deployed within the cluster using a
deploymentmanifest. The deployment creates areplica setto manage the application's pod.A
serviceis also created to manage the port, and arouteallows external connectivity to the application via the service.Also a
servicemonitoris created. This service allows the communication between the application and Prometheus.This is the
deploymentfor the application, where we can see 1 pod has been created: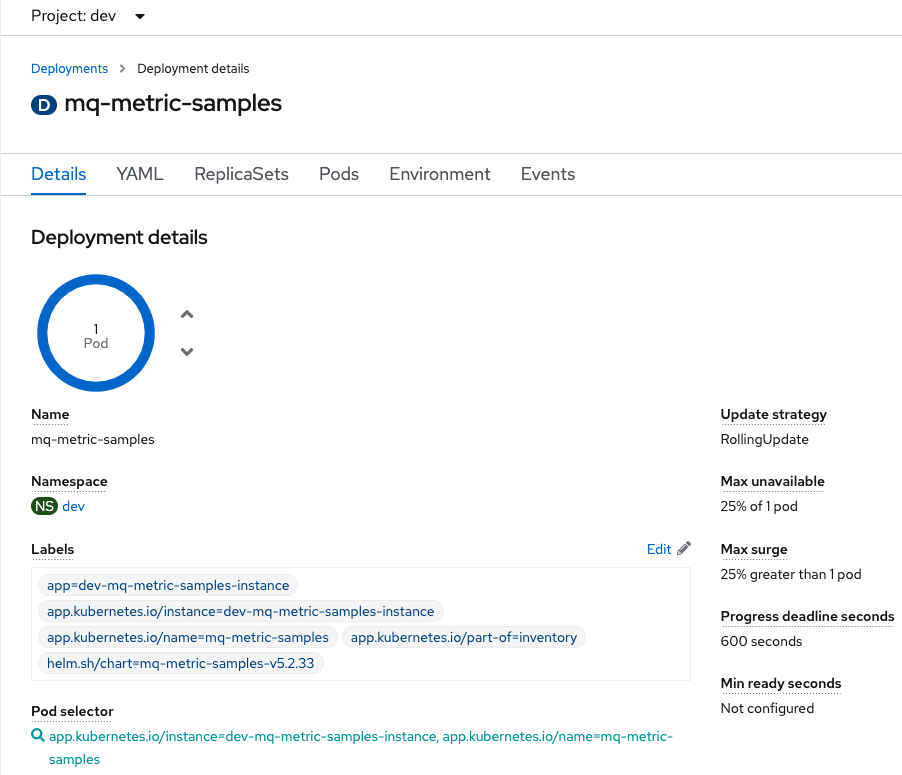
You can also view the
deploymentfrom the command line:oc project dev oc describe deployment mq-metric-samplesThe application writes logs to stdout. These can be viewed from the command line. First of all find the name of the running
mq-metric-samplespod:oc get pods -l app.kubernetes.io/name=mq-metric-samplesUsing the name of the running
mq-metric-samplespod, the following commands displays its logs:oc logs mq-metric-samples-6545f985f-vxh82Note that since we deleted the firs pod, the new one has a different name.
-
Review the application's service
This shows the corresponding
service, where we can see the application's port 9157 (this is the metrics port) inside the application pod is being mapped toport 9157at the cluster level: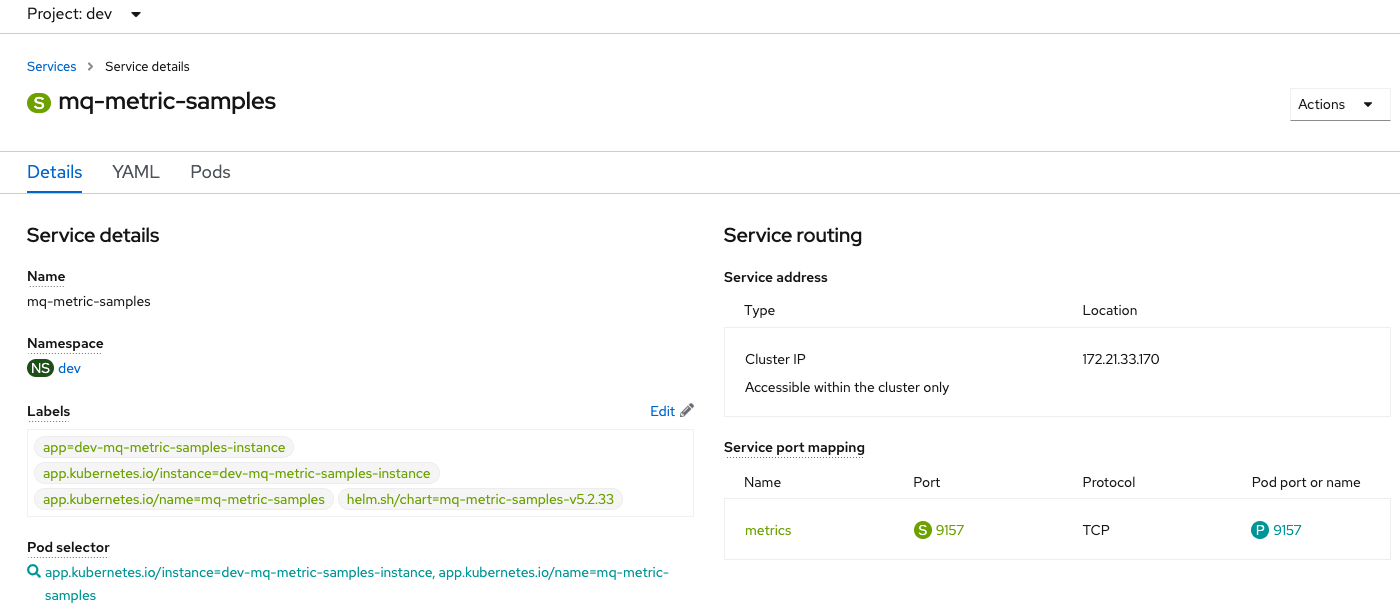
You can also view the
servicefrom the command line:oc describe service mq-metric-samples -
Review the application's servicemonitor
This shows the
servicemonitorused to map the application metrics port so Prometheus is able to collect the metrics. Here, the interesting information can be viewed in the yaml view: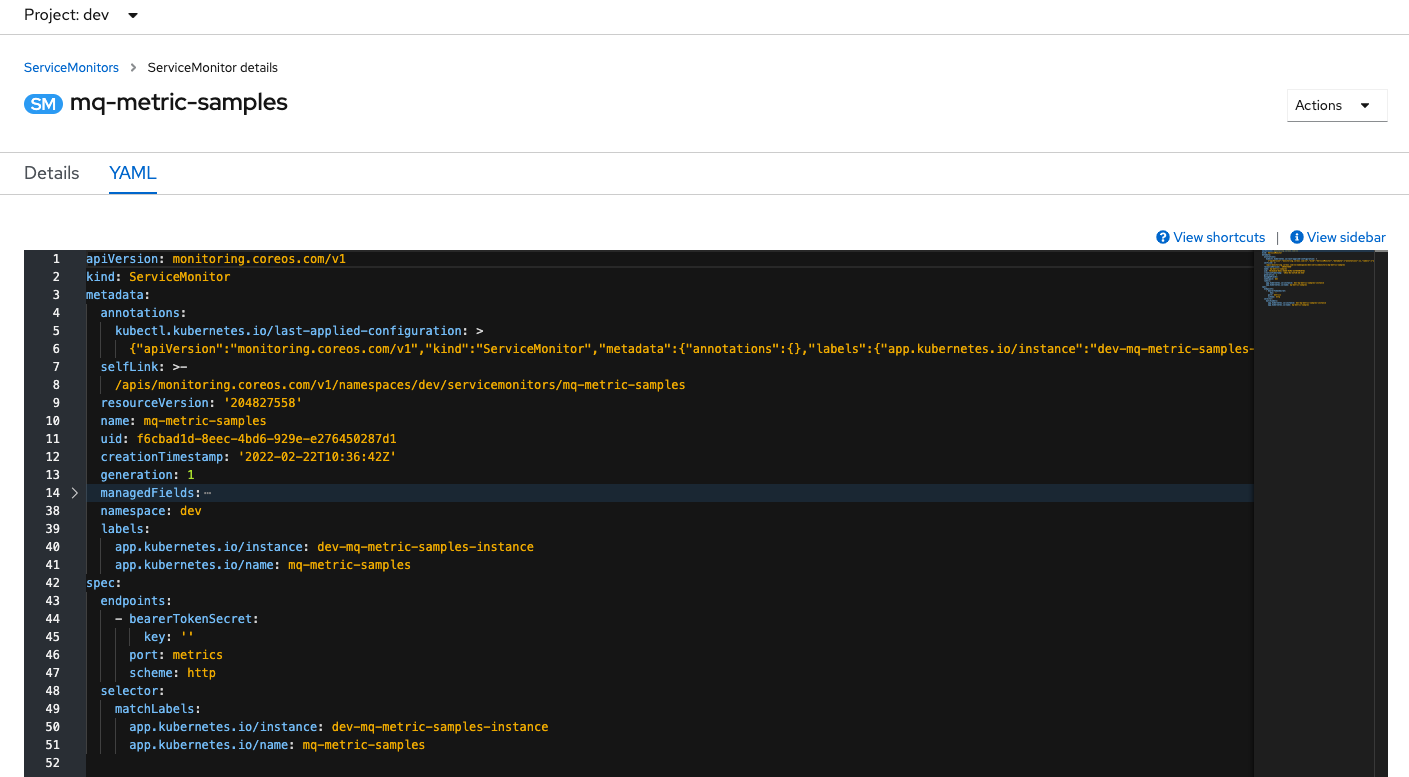
You can also view the
servicemonitorfrom the command line:oc describe servicemonitor mq-metric-samplesPrometheus follows a pull approach when we talk about the way metrics are collected. Servicemonitor resources is the way Prometheus monitoring system can find the endpoints to collect metrics. Let's look at the following lines in the servicemonitor yaml:
  selector:
    matchLabels:
      app.kubernetes.io/instance: mq-metric-samples
      app.kubernetes.io/name: mq-metric-samples
This selector is trying to find the resources that contains the labels listed. If we have a look to our deployment labels we will see:
  labels:
    app: mq-metric-samples
    app.kubernetes.io/instance: mq-metric-samples
    app.kubernetes.io/name: mq-metric-samples
    app.kubernetes.io/part-of: inventory
    argo.cntk/instance: dev-mq-metric-samples-instance
    helm.sh/chart: mq-metric-samples-1.0.0-rcv5.2.8
This is the way the monitoring system is finding the endpoint exposed by the metrics app.
-
Review the application's route
Finally the
routeshows the external URL (location) we can use to inspect the metric values exported by the application in the moment of hitting the URL: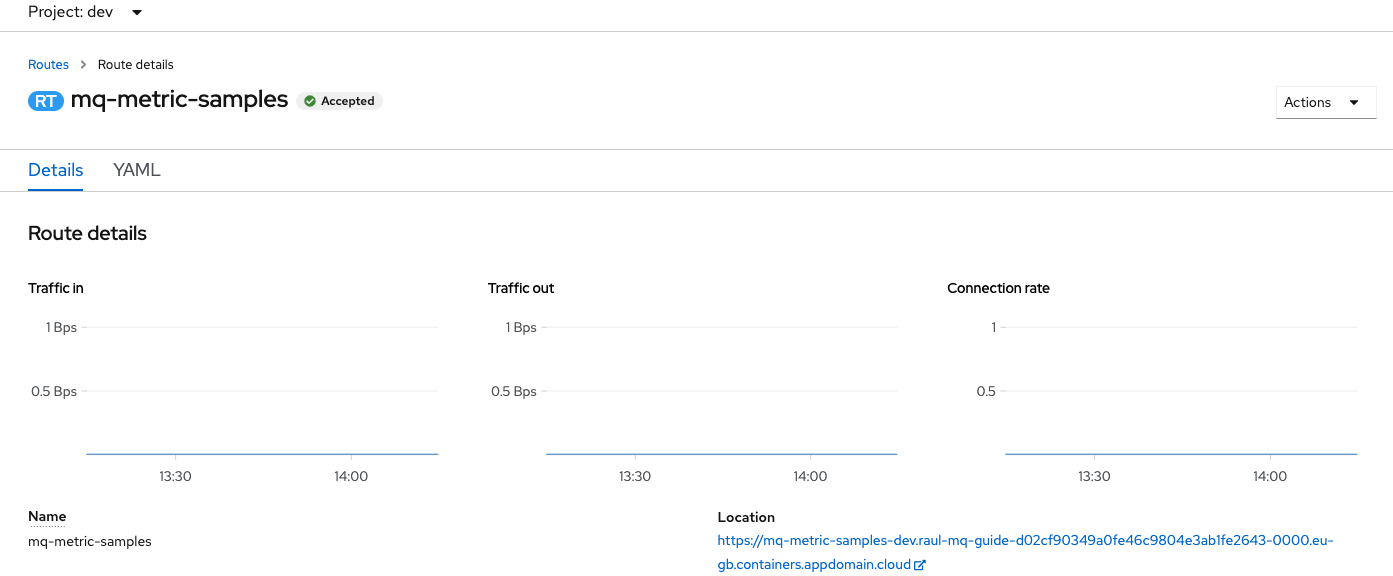
You can also view the
routefrom the command line:oc describe route mq-metric-samples -
Check the application is running
Using the
locationvalue from theroutewe can call the application to check its exporting metrics adding/metricsto the route:export APP_URL=$(oc get route -n dev mq-metric-samples -o jsonpath="{.spec.host}") curl -X GET https://$APP_URL/metricsThe output is similar to the following.
# HELP go_gc_duration_seconds A summary of the pause duration of garbage collection cycles.
# TYPE go_gc_duration_seconds summary
go_gc_duration_seconds{quantile="0"} 7.465e-05
go_gc_duration_seconds{quantile="0.25"} 8.9893e-05
go_gc_duration_seconds{quantile="0.5"} 0.00015446
go_gc_duration_seconds{quantile="0.75"} 0.000577563
go_gc_duration_seconds{quantile="1"} 0.00205311
go_gc_duration_seconds_sum 0.003462792
go_gc_duration_seconds_count 7
# HELP go_goroutines Number of goroutines that currently exist.
# TYPE go_goroutines gauge
go_goroutines 13
# HELP go_info Information about the Go environment.
# TYPE go_info gauge
go_info{version="go1.16.12"} 1
...
The output here has been truncated but if you examine the whole result you will see that the information shown are the metrics that are being exposed and you are seeing the values at the moment of visiting the URL. Further down the output you will see the new MQ metrics such as
ibmmq_queue_depthoribmmq_queue_oldest_message_age. -
Review one of the exported metrics
If we examine one of these lines, we can see something like:
ibmmq_queue_depth{description="-",platform="UNIX",qmgr="QM1",queue="IBM.DEMO.Q",usage="NORMAL"} 0The metric name is
ibmmq_queue_depth. This metric consists in a set of values. Under this metric name all the queue depths of the queue manager are recorded.Between brackets we can see a comma separated list of key-value pairs. These are attributes that defines the metric for each individual queue. We can highlight the queue manager
qmgrand the queue namequeue. Last, but not least, at the end of the line the measure captured for the metric with those attributes is provided. In this case0because the queue still does not hold any messages. -
Check the new metrics are shown in the metrics UI
Now that the new metrics are being exposed, we are able to find them in Prometheus. Navigate to the
Monitoring > Metricssection in OpenShift web console.In the query textarea provide one of the new metrics like
ibmmq_queue_depthand press enter.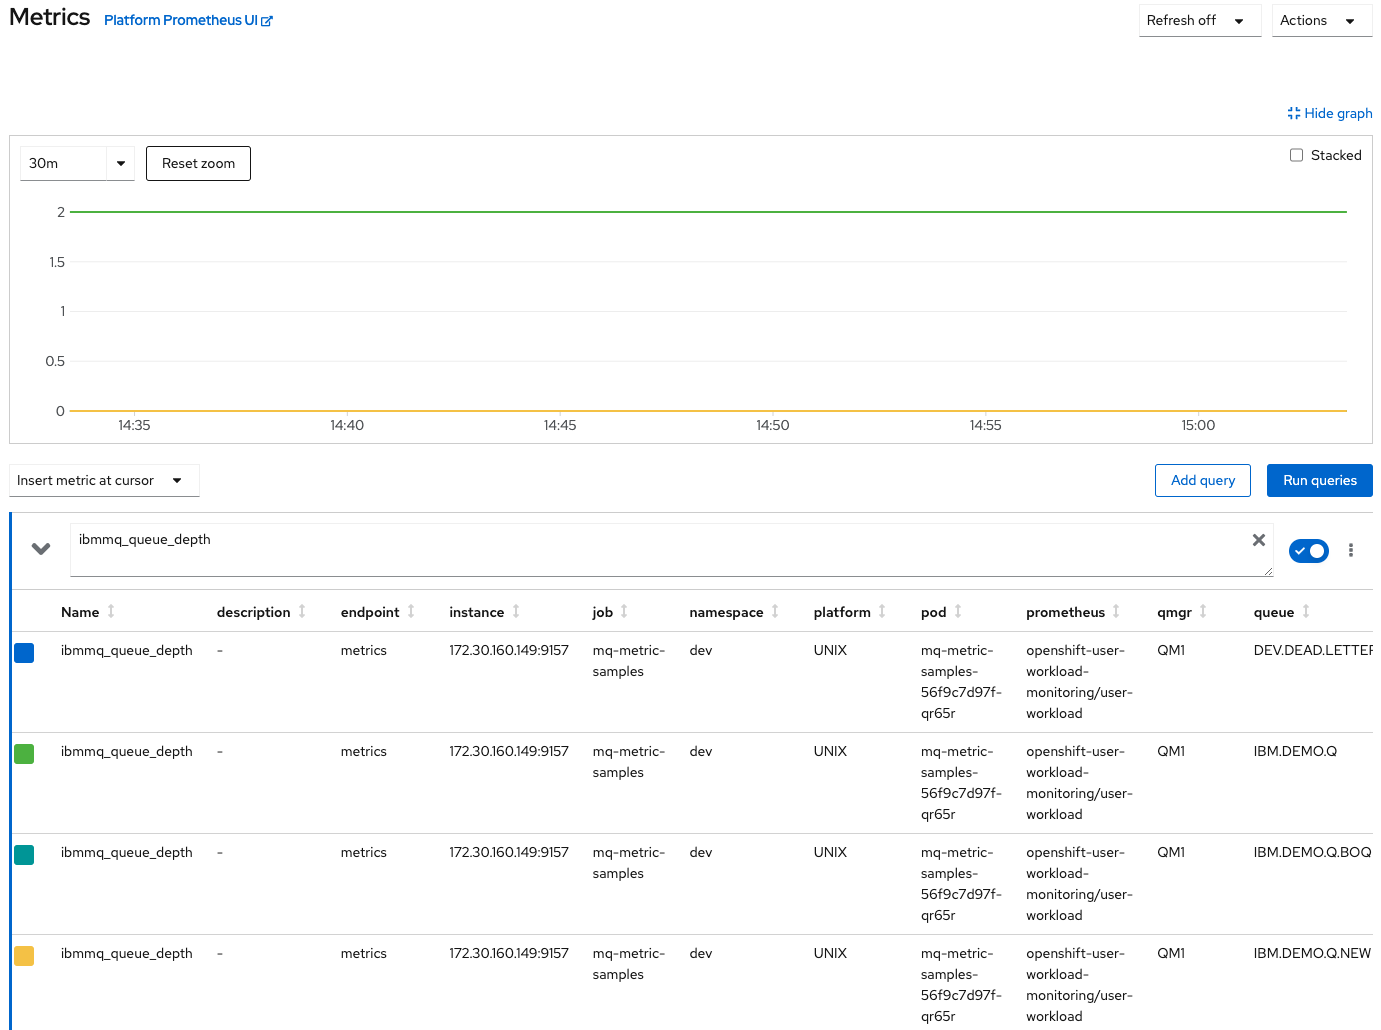
Results appear represented in a graph and listed under it. What we have done is to query using a metric name, but we have not provided any other detail. Then our query is retrieving the queue depth for all the queues in all the queue managers.
Despite these metrics belongs to the user workload scope we are reaching it through the OpenShift metrics interface. Remember that in the previous topic we talked about this abstraction in the monitoring stack. We have two instances of Prometheus running, system workload and user defined workload, but we can reach all the metrics from the same UI no matter in which Prometheus instance these metrics are being stored.
-
Narrow down the query
If we want to have the results for a specific queue, we need to narrow down the query using the
queueattribute. If we are looking for the queue depth ofIBM.DEMO.Qqueue, then issue the queryibmmq_queue_depth{queue="IBM.DEMO.Q"}And you will have now only a single time series for this specific queue.
Congratulations!
You have successfully cloned and reviewed the metrics application source code. You have configured, and deployed it obtaining new metrics from our QM1. Finally you have been able to perform a query on Prometheus using the new exposed metric. In the next topic we are going to use one of these new metrics to customize the Grafana dashboard for MQ that we saw in the Monitoring stack section.