MQ scenario
Overview
Audience: Architects, Application developers, Administrators
In this topic, we're going to:
- Place our MQ system in the monitoring context.
- Analyze the scenario to monitor MQ.
- Configure the cluster to collect MQ metrics.
- Access CP4I Grafana instance.
Introduction
Now that we have identified OpenShift monitoring stack we are going to focus in MQ monitoring scenario.
As we saw in the previous topic, everything that is deployed on OpenShift that does not belong to the core system belongs to the user defined projects monitoring scope. Our MQ system is already exposing a set of metrics through a Prometheus endpoint. That is, our queue manager is already providing information that can be ingested by the monitoring stack. We will need to configure the cluster to start collecting these metrics.
Another element that we will need in our system will be a way to visualize these metrics. Since OpenShift Grafana instance is read-only, we need a different instance that we can use for that goal. Luckily, CP4I ships its own Grafana instance that we will leverage to have our MQ dashboard.
Monitoring scenario
With all that we know now let's review the monitoring scenario that we have.
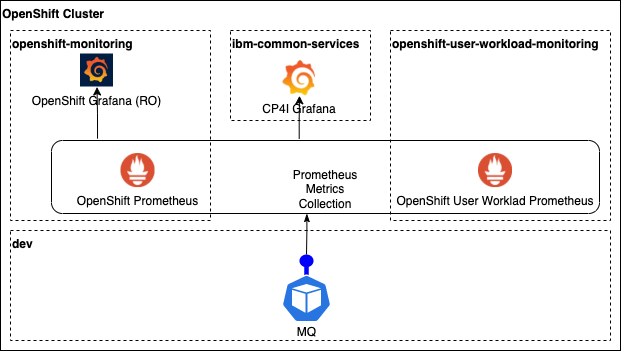
As mentioned in the monitoring stack review topic, we have the core monitoring system up and running in the openshift-monitoring project where we can find the system Prometheus and the read only Grafana instances. Once user workload monitoring is enabled, a new Prometheus instance is created in the openshift-user-workload-monitoring project along other monitoring components.
In the moment user workload monitoring is enabled we will have more than one Prometheus instances running but the monitoring components that are running in the cluster are going to create analyzing abstraction layer. From the Prometheus external point of view, we will deal with a single monitoring system and all the metrics collected from the core system or from user workloads, can be queried from the same interface.
This scenario is completed by a new Grafana instance that is deployed as part of the CP4I common services. This instance also provides a dashboard for our MQ system running in the dev project and we will be able to access and update it.
Enable monitoring for MQ
We are going to start with the configurations needed to have the user workload monitoring system enabled so the MQ metrics can be collected and ingested in Prometheus.
The process that we are going to follow is fully documented in the
Cloud Pak for Integration documentation, but we are going to review and implement it here.
At the end of this process, we will have new pods related to the monitoring stack in openshift-user-workload-monitoring project and the MQ metrics available in Prometheus.
-
Edit OperandConfig custom resource
The first step is about updating an existing configuration from the common services component deployed with CP4I.
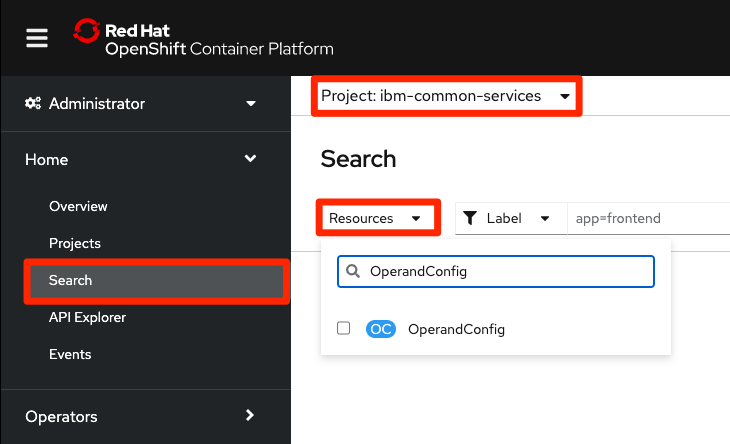
Go to the OpenShift web console and from the
Homesection selectSearchoption. Selectibm-common-servicesin the Project dropdown at the top of the screen to narrow down the search. Finally typeOperandConfigin theResourcesdropdown and click on the only option that remains in the list.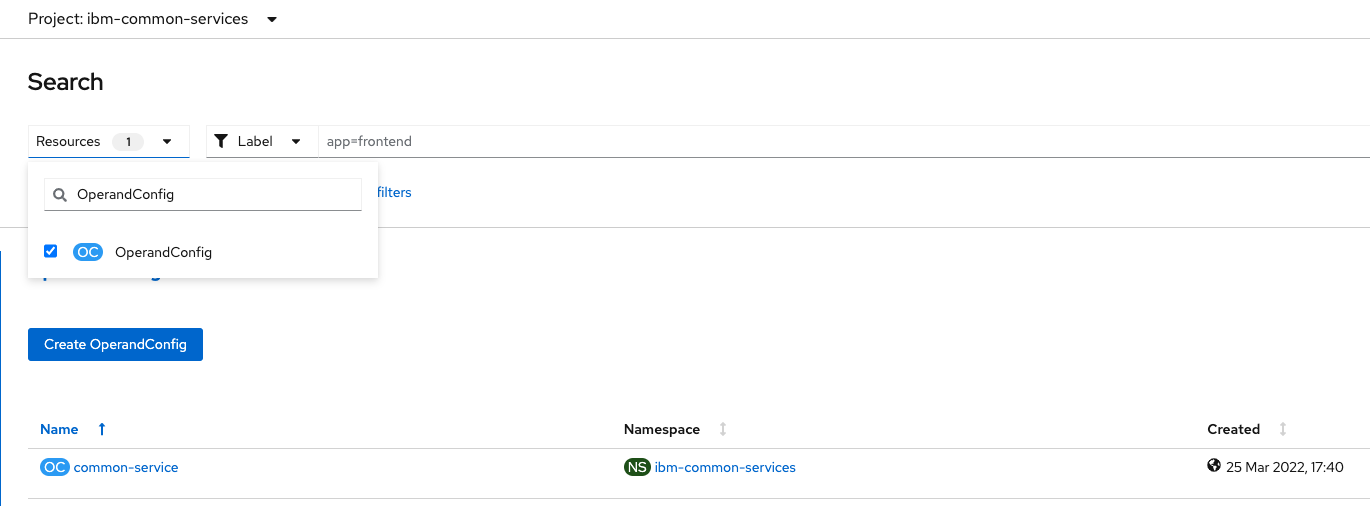
We are looking for the
common-serviceOperandConfig. Click on it and then select theYAMLtab. This yaml file already contains a list of services and we need to update the existingibm-monitoring-grafana-operatorservice. Look for it either inspecting the yaml or using the find feature as in any other browser or text editor (Win: Ctrl+F / MacOS: Cmd+F). Our update is about adding the two highlighted lines:apiVersion: operator.ibm.com/v1alpha1 kind: OperandConfig metadata: name: common-service namespace: ibm-common-services spec: services: ### Other existing services here - name: ibm-monitoring-grafana-operator spec: grafana: datasourceConfig: ### Enable using the OCP metrics as a data source type: "openshift" dashboardConfig: resources: limits: cpu: 20m memory: 80Mi requests: cpu: 20m memory: 30Mi grafanaConfig: resources: limits: cpu: 150m memory: 120Mi requests: cpu: 20m memory: 40Mi routerConfig: resources: limits: cpu: 50m memory: 50Mi requests: cpu: 20m memory: 20Mi operandRequest: {} ### Other existing services hereThis change is telling the CP4I Grafana instance to use OpenShift Prometheus as the data source to consume metrics to represent them in the dashboards.
Click
Savebutton. -
Create the OperandRequest resource
Now we need to create new resources.
We need an OperandRequest resource for just the Grafana operand in the
ibm-common-servicesnamespace so that it only requests the Grafana operand rather than also requesting the exporters and Prometheus operands.Still working with the OpenShift web console, click the import YAML button at the top of the screen.

A text editor will appear in the screen. Copy and paste the following piece of code to create the OperandRequest.
apiVersion: operator.ibm.com/v1alpha1
kind: OperandRequest
metadata:
  name: common-service
  namespace: ibm-common-services
spec:
  requests:
    - operands:
        - name: ibm-monitoring-grafana-operator
      registry: common-service
Click
Createbutton at the bottom and you will see the new OperandRequestcommon-servicesresource.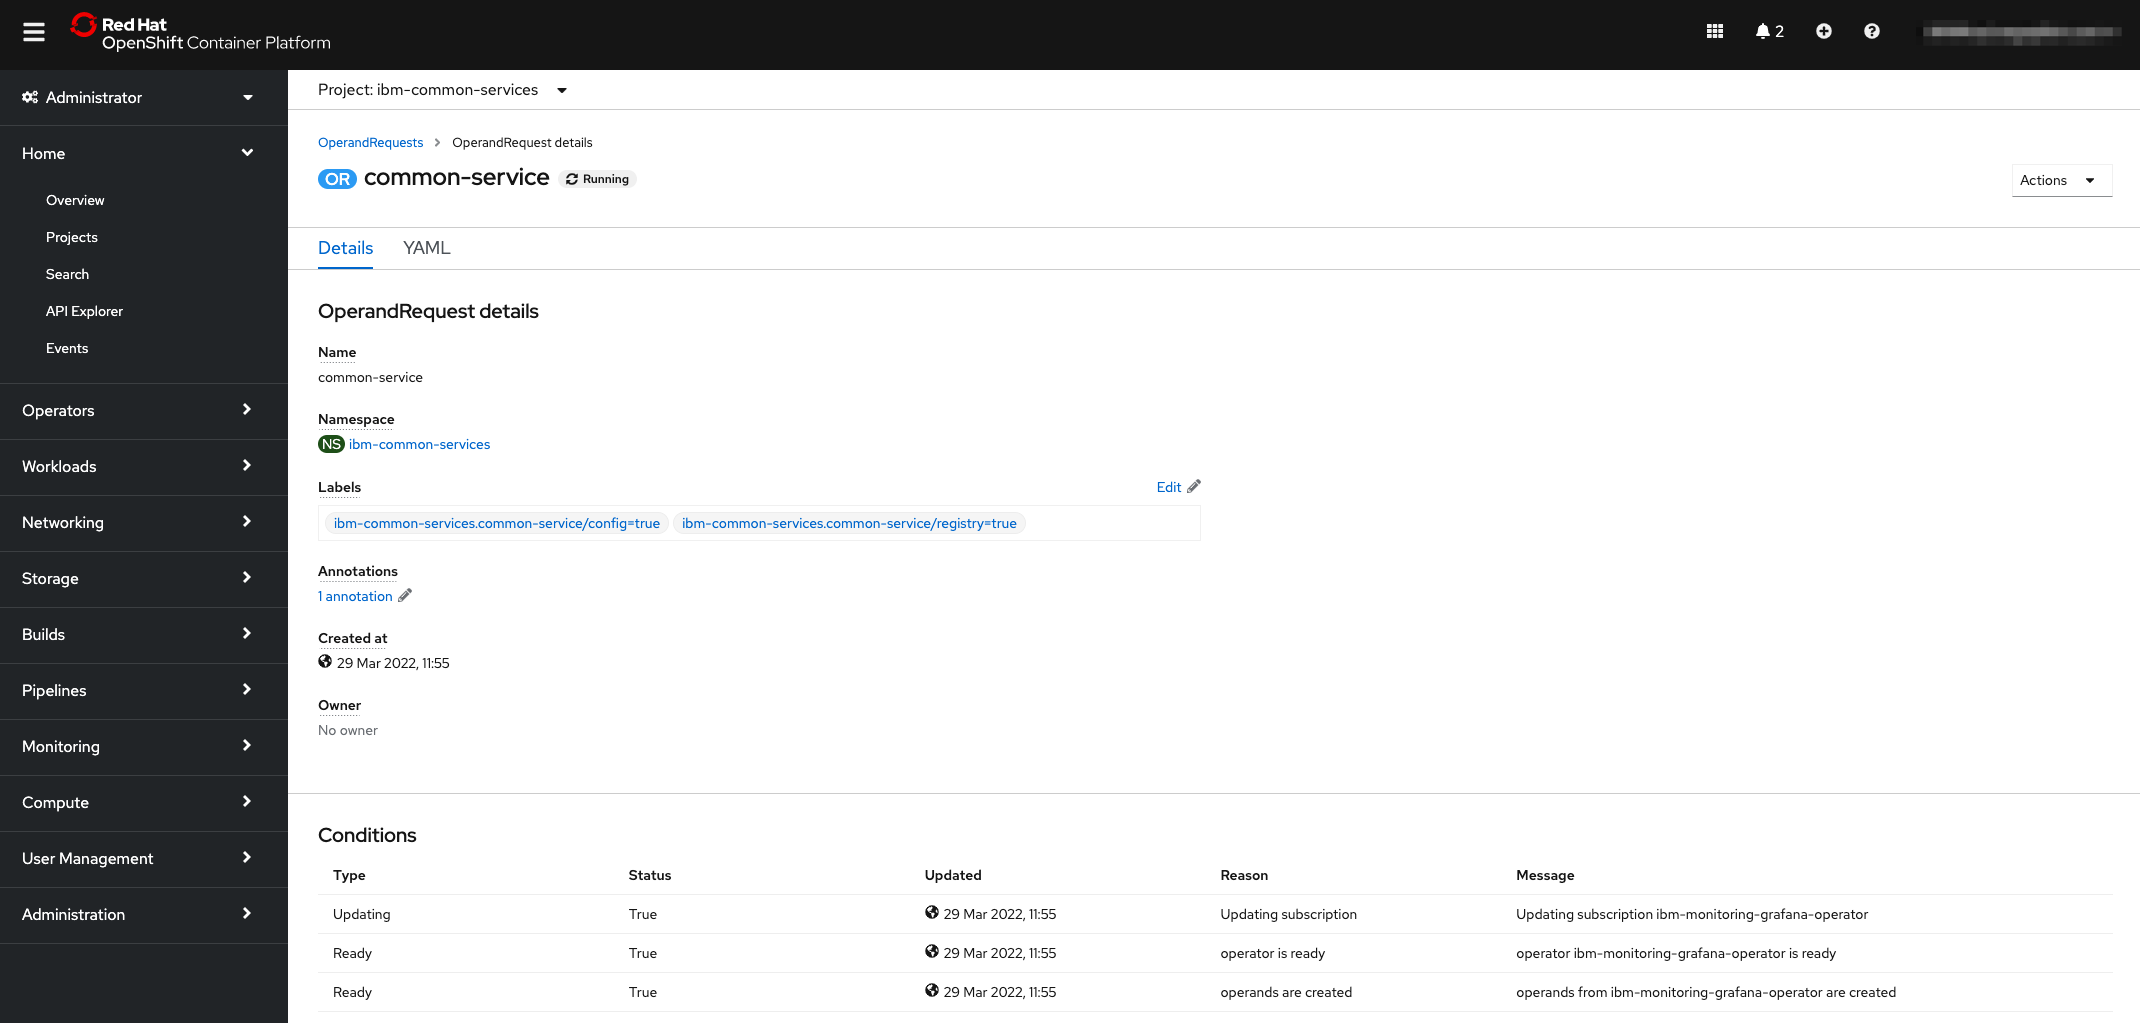
-
Enable user defined projects monitoring
We need to create a last resource following the same procedure we used to create the OperandRequest. In this case we are going to create a ConfigMap. Click again in the import YAML button at the top of the screen and copy and paste the following piece of code:
apiVersion: v1
kind: ConfigMap
metadata:
  name: cluster-monitoring-config
  namespace: openshift-monitoring
data:
  config.yaml: |
    enableUserWorkload: true
Note that now the project where the ConfigMap is going to be created is
openshift-monitoring. With this configuration we are enabling the user workload monitoring in the cluster.Click
Savebutton.Confirm that the ConfigMap is created. You can switch to the
Workloads > ConfigMapsscreen in the OpenShift left menu. Switch to theopenshift-monitoringproject in the project dropdown and search for thecluster-monitoring-configConfigMap.
-
Check new pods created
Now we have the user project defined monitoring stack configured and new monitoring components have been created for this purpose. Let's check that all those components are running.
Switch back to your terminal window. We are going to verify that the
prometheus-operator,prometheus-user-workloadandthanos-ruler-user-workloadpods are up and running in theopenshift-user-workload-monitoringproject. It might take a few minutes for the pods to start:oc -n openshift-user-workload-monitoring get podYou should get an output similar to this:
NAME                                   READY   STATUS        RESTARTS   AGE
prometheus-operator-6f7b748d5b-t7nbg   2/2     Running       0          3h
prometheus-user-workload-0             4/4     Running       1          3h
prometheus-user-workload-1             4/4     Running       1          3h
thanos-ruler-user-workload-0           3/3     Running       0          3h
thanos-ruler-user-workload-1           3/3     Running       0          3h
Explore all the other resources generated due to the enablement of the user workload monitoring.
oc -n openshift-user-workload-monitoring get all -
Check MQ metrics available
The cluster is now configured so the MQ metrics are being collected by Prometheus. It is now time to check that we can find them in Prometheus. Going back to OpenShift web console, go to the
Monitoring > Metricsscreen. Start typingibmmq_qmgrin the expression text box. Several metrics should appear now in the available metrics list meaning that Prometheus has ingested them and we can use them to perform searches and build our dashboards.
CP4I Grafana
To close this section, we are going to review how to access CP4I Grafana instance and we will review the dashboard that is provided by default.
Ensure that you are logged in your OpenShift cluster from the terminal we have been using.
oc login --token=<token> --server=<server>
We can access Grafana UI through the platform navigator. We can obtain its URL from the route:
PN_URL=$(oc get route integration-navigator-pn -n tools -o jsonpath="{.spec.host}")
echo "https://$PN_URL"
Login into the Platform Navigator using admin user and the password you can extract issuing the following command:
oc -n ibm-common-services get secret platform-auth-idp-credentials -o jsonpath='{.data.admin_password}' | base64 -d && echo
On the left hand side menu, select Integration runtimes option.
The screen then presents all the integration runtimes. Click on the three dots menu on the right hand side and select Monitoring option.
A new tab will open in the browser with the Grafana UI that we can use to configure our dashboard. Initially there is a default dashboard provided for MQ with several metrics and graphs.
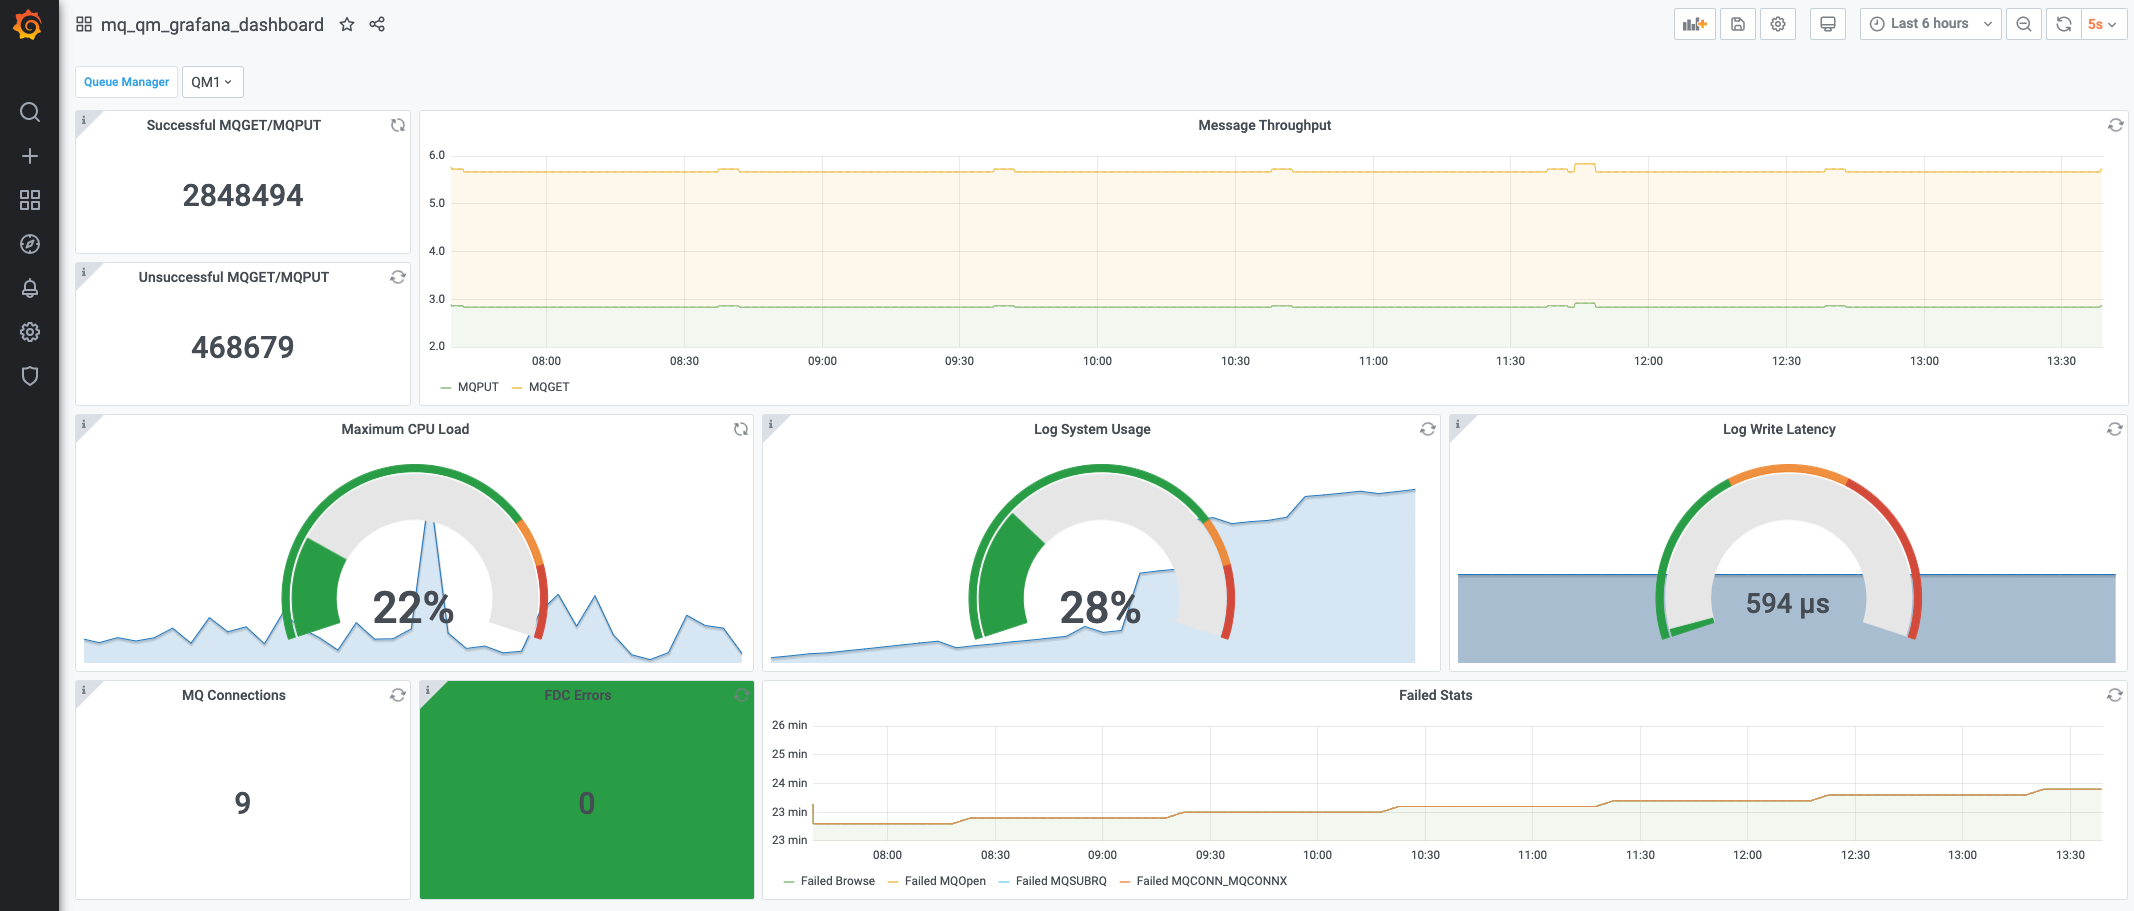
By now, to improve the experience set the refresh time to 5m. In the upper-right corner there is a dropdown set to 5s. Change it to 5m to avoid performing constant queries to Prometheus. For our activity 5 minutes refresh will be more than enough.
Launching Grafana UI
Sometimes we have viewed that MQ dashboard does not appear and instead, we have system dashboards. In such case close the Grafana tab and launch it again from the integration runtime monitoring link.
Congratulations!
You've now the monitoring stack configured and MQ metrics has started to reach Prometheus. We have also seen how these new metrics are used to compose a monitoring dashboard in the CP4I Grafana instance. In the next topic, we're going to expand the use case to obtain new MQ metrics that are not exposed by default.