MQ High Availability Architectures: In-Region Active Passive
Overview
Audience: Architects, Application developers, Administrators
In this topic, we're going to:
- learn the essential elements of what provides NativeHA high-availability to the latest versions of IBM MQ
- understand the impact at the infrastructure, services, and application tiers which a high-availability requirement brings
- deploy this topology to your OpenShift cluster
Architecture Overview
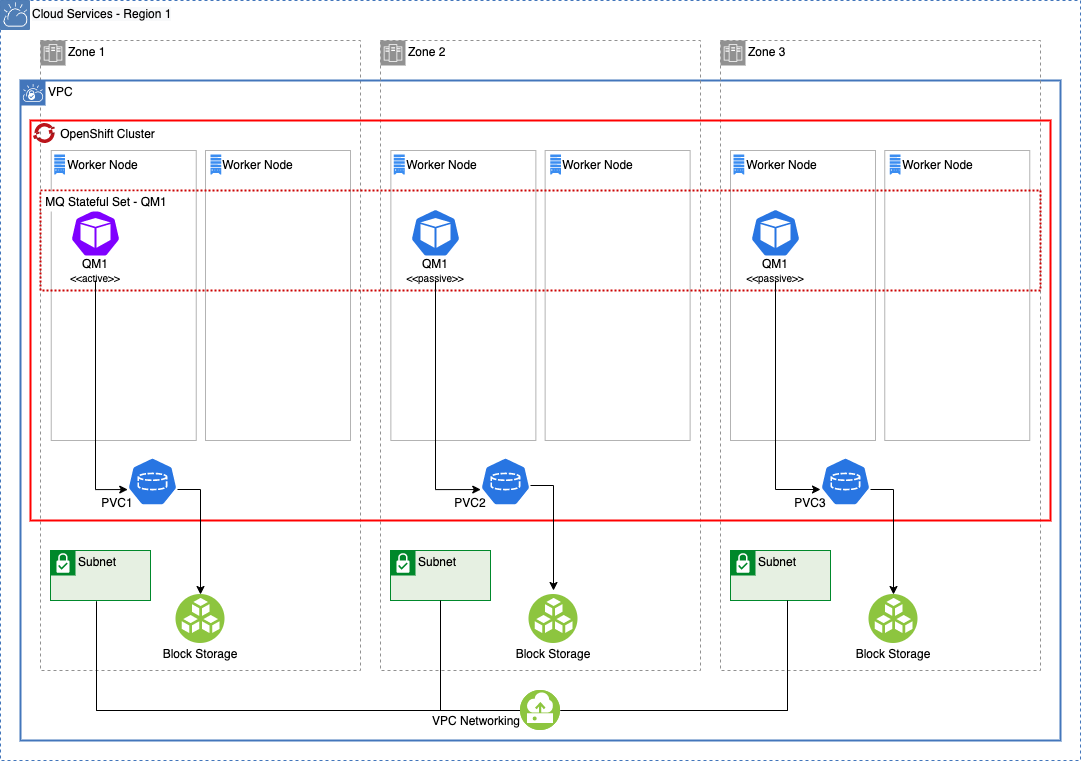
The following components comprise the high-availability topology at a high level. As your desired topology evolves to reduce single points of failure, this list will become more robust in nature.
-
Virtual Private Cloud:
- Distribute workloads across a minimum of three (3) sets of infrastructure service resources in 3 distinct availability zones (AZ).
-
Red Hat OpenShift Container Platform:
- Minimum two (2) OpenShift Compute Nodes per AZ to achieve standard OpenShift SLOs (99.99% possible).
-
IBM MQ - Native HA Queue Manager:
- Minimum one (1) OpenShift Node in each AZ for normal mode operations.
- Minimum two (2) OpenShift Nodes in each AZ during OpenShift Node maintenance.
-
MQ Client Application:
- Stateless container-based client application
- Leverage anti-affinity deployment practices where possible
Single Points of Failure
These services and infrastructure components have been identified as potential single points of failure in this topology:
- Red Hat OpenShift Container Platform
- Queue Manager instance
- Regional Cloud Networking
- Regional Cloud Storage
- Regional Cloud Ingress/Egress
Infrastructure Requirements
This topology, as it is the simplest topology which still provides high-availability, it also requires the least amount of bespoke support from the underlying infrastructure.
- Block Storage with ReadWriteOnce support
- Multiple availability zones inside of a single region
MQ Assets
All of the high-availability topologies in this deployment guide leverage the NativeHA feature of IBM MQ for resiliency. As the topologies grow more complex, additional configurations and deployments are added to this least-common architectural denominator.
The recently released NativeHA capability allows for multiple QueueManager pods to be running, with only one of them truly being "active" and receiving traffic from the OpenShift Route or Service. The running pods, managed by a StatefulSet on the underlying Kubernetes-based platform, actively share log and message data between the active and passive QueueManager instances. Once the active QueueManager instance becomes unavailable for any reason, the remaining passive pods take advantage of the RAFT algorithm to elect a new leader and within seconds failover to a different QueueManager instance, while minimizing service and message unavailability.
For more details on the early release of NativeHA for IBM MQ 9.2, you can check out the official IBM MQ Docs.
Our example here sets the following properties in the QueueManager YAML file and pushes the changes to your GitOps repo:
availability:
  type: NativeHA
  tls:
      secretName: <inter-queuemanager-tls-cert-secret>
      cipherSpec: ANY_TLS12_OR_HIGHER
storage:
  defaultClass: ibmc-vpc-block-metro-10iops-tier
  queueManager:
    enabled: true
    size: 2Gi
    type: persistent-claim
- The
availability.typesetting is required to beNativeHAto take advantage of this capability. - The
availability.tlssetting allows for TLS-encrypted communication between QueueManager instances in the StatefulSet. - The
storage.defaultClasssetting should point to a multi-AZ supported storage class the provides ReadWriteOnce storage capability for Block Storage. - The
storage.queueManagersetting is required to be enabled and set to typepersistent-claimfor NativeHA fail-over capability to function.
Client Application Recommendations
Our sample client application is available under the Building MQ applications section. There are minimal additional configuration requirements to deploy the client application connected to this topology.
To be addressed:
- Automatic client reconnection
- Connects to a single Route URL provided by the MQ QueueManager instance
- As only a single region is deployed, there is no consideration given for message sequencing needs beyond traditional single QueueManager requirements.
Deploy the HA Topology
Warning
Needs to be updated (2021/09/08)
Audience: Architects, Application developers, Administrators
In this topic, we're going to:
- deploy an in-region, active-passive MQ topology to your OpenShift cluster
- consisting of a multi-AZ NativeHA-enabled Queue Manager
- and stateless, multi-AZ client application
Pre-requisites
In order to deploy a highly-available QueueManager and MQ client application, we require the following prerequisites to be configured and installed:
-
Create the cluster on the infrastructure of choice, ensuring inclusion of multiple availability zones (AZ).
-
Configure the cluster. This includes:
-
ensuring an availability-zone-aware, block storage StorageClass is available on the cluster.
-
Ensure you are logged into your cluster from the command line.
Based upon these prerequisites, the sections below will not be covering each step as in-depth as previous sections have. If you require more explanation or understanding of certain topics or commands, please reference the relevant Configuring the cluster, Building queue managers, and Building MQ applications sections appropriately.
Apply high-availability GitOps baseline
This section will cover bootstrapping your cluster with everything that is required to deploy a highly-available MQ queue manager and relevant components. The artifacts used in this section are an extension of what was previously used in the Configuring the cluster, Building queue managers, and Building MQ applications sections, albeit in a more streamlined manner.
-
Fork the sample GitOps repository
We're going to use the same sample GitOps repository as the previous sections, however we will be utilizing a different branch.
Fork the sample configuration repository at
https://github.com/cloud-native-toolkit/multi-tenancy-gitopsto your GitHub account, if not done previously. -
Set up environment variable for GitHub name
This tutorial uses environment variables to save typing and reduce errors. Similar to the previous sections, you must define the following environment variables with values specific to your environment. Replace the placeholder values in the following commands with values specific to your environment.
export GIT_USER=<git-user>
export GIT_BRANCH=demo-mq-v2-ha
export CLUSTER_DOMAIN=<xyz.clusterdomain.com>
You can verify the environment variables are set correctly as follows:
echo $GIT_USER echo $GIT_BRANCH echo $CLUSTER_DOMAIN -
Clone forked GitOps repository
Similar to previous sections, we are going to work on a local clone of our GitOps repository. We'll push changes to our local copy back to GitHub at appropriate times so that they can be accessed by ArgoCD.
Clone the forked Git config repository to your local machine:
git clone https://github.com/$GIT_USER/multi-tenancy-gitops.git -
Checkout
demo-mq-v2-habranchThe sample repository contains multiple branches, each of which contains a different repository for different IBM Cloud Pak products. We're going to use a branch containing a sample GitOps configuration for highly-available Cloud Pak and MQ components.
cd multi-tenancy-gitops git checkout $GIT_BRANCH -
Run the customization script
Let's customize our cloned GitOps repository with the relevant values for our cluster.
The sample GitOps repository provides a
set-git-source.shscript to make this task easy. It uses the$GIT_USER,GIT_BRANCH, andCLUSTER_DOMAINvariables you defined in the previous steps to customize the repository with your GitHub organization:Run the script:
./scripts/set-git-source.sh -
Commit & push updates to forked gitops repository
We've now customized our local clone of the GitOps config repository. Let's commit these changes and make the customized repository available to the cluster via GitHub.
Add, commit, and push all changes in the current folder to your GitHub repository:
git add bootstrap.yaml 1-infra 2-services 3-apps
git commit -s -m "GitOps customizations for organization and cluster"
git push origin $GIT_BRANCH
The customized repository is now ready to be used by ArgoCD.
-
Ensure you're logged in to the cluster
Start a terminal window and log into your OCP cluster, substituting the
--tokenand--serverparameters with your values:oc login --token=<token> --server=<server>If you are unsure of these values, click your user ID in the OpenShift web console and select "Copy Login Command".
-
Install Tekton into the cluster
We use the Red Hat Pipelines operator to install Tekton into the cluster.
The following command creates the subscription:
oc apply -f 2-services/operators/openshift-pipelines/operator.yaml -n openshift-operatorsThe response confirms that the subscription has been created:
subscription.operators.coreos.com/openshift-pipelines-operator createdIt will take a little time for the operator to install; this is just the subscription. Refer to Installing Tekton and ArgoCD for GitOps] for additional instructions on validating successful operator installation, if needed.
-
Install ArgoCD into the cluster
We use the Red Hat GitOps operator to install ArgoCD into the cluster.
The following command creates the subscription:
oc apply -f 2-services/operators/openshift-gitops/operator.yaml -n openshift-operatorsThe response confirms that the subscription has been created:
subscription.operators.coreos.com/openshift-gitops-operator createdIt will take a little time for the operator to install; this is just the subscription. Refer to Installing Tekton and ArgoCD for GitOps for additional instructions on validating successful operator installation, if needed.
-
Configure an ArgoCD
clusterroleandclusterrolebindingArgoCD runs under a dedicated service account. For good governance, we use a custom clusterrole and clusterrolebinding to control the specific operations this service account can perform on different resources in the cluster.
The cluster role and the cluster role binding YAMLs are in the
1-infra/clusterrolefolder. We can apply them both to the cluster with the following command:oc apply -f 1-infra/clusterrole -
Apply ArgoCD
bootstrap.yamlRecall that you pushed the customized local copy of the GitOps repository to your GitHub account. By applying the
bootstrap.yaml, we're creating an ArgoCD application that is watching this repository and using its contents to manage the cluster.Apply the bootstrap YAML to the cluster:
oc apply -f bootstrap.yaml -n openshift-gitopsThe
bootstrapArgoCD application will watch the0-bootstrap/argocd/activefolder in our GitOps repository on GitHub.This is the only manual operation we need to perform; from now on, all cluster operations will be performed via Git operations to this repository.
-
Launch ArgoCD
ArgoCD can be accessed via an OpenShift route. Using a browser, navigate to the URL returned by following command:
oc get route -n openshift-gitops argocd-cluster-server -o jsonpath="{.spec.host}"This will list the route to the ArgoCD we've just installed, for example:
argocd-cluster-server-openshift-gitops.aod-cloud-native-1-d02cf90349a0fe46c9804e3ab1fe2643-0000.eu-gb.containers.appdomain.cloudCopy the URL into your browser to launch the ArgoCD web console UI.
(You can safely ignore any browser certificate warnings.)
-
Login to ArgoCD
Sign in with user admin.
The password is stored in a Kubernetes secret in the cluster. Use the following command to retrieve and format it:
oc get secret/argocd-cluster-cluster -n openshift-gitops -o json | jq -r '.data."admin.password"' | base64 -D -
Verify ArgoCD Applications are synced, progressing, and healthy
ArgoCD Applications with names and artifacts matching
services-X-secretswill be in aDegradedstate due to missing MQ secrets. This is expected and will be resolved by the steps performed in subsequent sections.Otherwise, all ArgoCD Applications and artifacts should display a
SyncedandHealthystate after a period of time, due to iterative waves of reconciliation.
Review queue manager configuration
Follow latest from https://pages.github.ibm.com/cloudpakbringup/mq-deployment-guide/qmgr-pipeline/topic1
-
Install kubeseal locally
-
Create IBM Entitled Registry secret in
cinamespace via SealedSecret pattern -
Ensure GitHub access token is created on your GitHub account
-
Create GitHub access token secret in
cinamespace via SealedSecret pattern -
Commit and push all changes to the forked gitops repository
- Ensure to omit the YAMLs that are created in the root repository directory
-
Fork and clone https://github.com/cloud-native-toolkit/mq-infra
-
Run the
mq-infra-devpipeline in thecinamespace, pointing to your forkedmq-infrarepository. -
Update
values.yamlfor NativeHA support as below... -
Pipeline should run automatically???
-
To be continued...???
-
Update the queue manager configuration
From the main directory of the cloned GitOps repository source, change to the
2-services/instances/namespace-dev/mq-infradirectory:Display the content of the
values.ymlby running:cat values.ymlThe configuration options to specifically enable this capability are the
queuemanager.availabilityandqueuemanager.storageoptions in thevalues.yamlfile. Replace the contents ofvalues.yamlwith the following updates, ensuring to select an appropriate StorageClass for your infrastructure provider.global: {} queuemanager: availability: type: NativeHA tls: secretName: mq-server-cert cipherSpec: ANY_TLS12_OR_HIGHER storage: defaultClass: ocs-storagecluster-ceph-rbd queueManager: size: 2Gi type: persistent-claim -
Activate the QueueManager development instance
mv 2-services/argocd/inactive/instances/ibm-mq-dev-instance.yaml 2-services/argocd/active/instances/git commit -a -m "Activating MQ HA dev instance"git push- Validate QueueManager pods start successfully (a total of 3).
- One will be
Ready 1/1 - Two will be
Ready 0/1
- One will be
Review client application configuration
Follow latest from https://pages.github.ibm.com/cloudpakbringup/mq-deployment-guide/dev/app
-
Fork and clone
https://github.com/cloud-native-toolkit/mq-spring-app -
Set
replicaCount: 3invalues.yaml. -
Commit & push changes to your forked
mq-spring-apprepo -
Create pipeline via
oc pipeline --tekton. -
Activate app-level resources your forked gitops repo:
-
mv 3-apps/argocd/inactive/dev-mq-spring-app.yaml 3-apps/argocd/active/ -
git commit -a -m "Activating MQ Spring application" -
git push
-
-
Validate pipeline run & updated pod counts, spread across zones in the cluster
Validate NativeHA high-availability using JMeter
Jmeter scripts have been provided to facilitate the demonstration of MQ NativeHA high-availability.
In this section, you will use Jmeter to send JSON requests to the Sample App which will then PUT messages on an MQ Queue, GET them back and respond back to JMeter. All messages will be processed by the active MQ pod while the other two pods remain in a passive mode.
During the JMeter test, you will demo kill the active MQ pod which will result in a passive MQ pod becoming active and starting to accept messages.
In a real production scenario, the application would likely retry sending the message to MQ a number of times before sending a failure to the caller, however, for demonstration purposes the application doesn't retry and sends a failure back to Jmeter immediately upon being unable to PUT the message to MQ. It is expected that it will take up to 5 seconds for an inactive passive pod to become the active pod and begin to accept messages.
It is assumed that you have already:
-
Configured MQ for NativeHA high-availability in active-passive mode (a StatefulSet of 3 pods with one active/running and two passive/waiting)
-
Configured the Sample
mq-spring-appSpring application
Now we will run the Jmeter test
-
Locate the JMeter script in the mq-spring-app repo
Navigate to the root of the
mq-spring-appcloned repository on your filesystem and issue the following command to verify the existence of themq-spring-app.jmxfile which you will use later.ls -la jmeter/mq-spring-app.jmx -
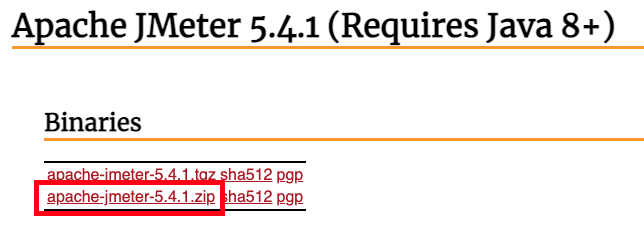
Download Jmeter to your machine
Download and extract the JMeter zip from http://jmeter.apache.org/download_jmeter.cgi
-
Launch JMeter from a terminal window
<JMeter install folder>/bin/jmeter.sh -
Load the sample script
From the JMeter UI, click File -> Open and then navigate to the
mq-spring-app git repository> and select mq-spring-app.jmxfile. -
Get the route URL for the sample application
Use the following command to get the route URL for the sample application from the
devnamespaceoc get route mq-spring-app -n devThe response will be similar to the one shown below. The
HOST/PORTvalue is theROUTE URLvalue that you will need in the next stepNAME HOST/PORT PATH SERVICES PORT TERMINATION WILDCARD mq-spring-app mq-spring-app-dev.gitops-mq-ha-6ccd7f378ae819553d37d5f2ee142bd6-0000.tor01.containers.appdomain.cloud mq-spring-app <all> edge None -
Update the cluster URL
The Test Plan has been configured with a user-defined variable to make it easy to use in any environment. It is necessary to update the variable with the URL of the
routeof the sample application in your environment so that JMeter knows where to send the requests.In Jmeter, click on "Test Plan" and then update the user defined variable “CLUSTER” to the
ROUTE URLthat you collected in the previous step and save your change.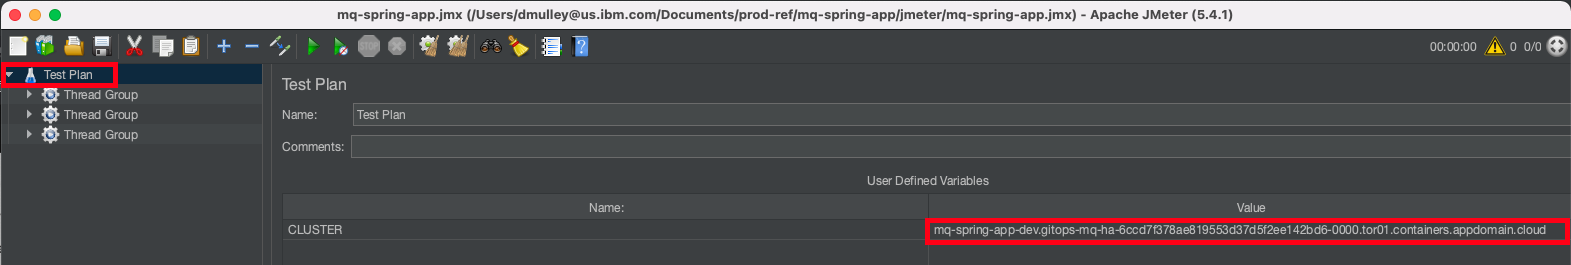
-
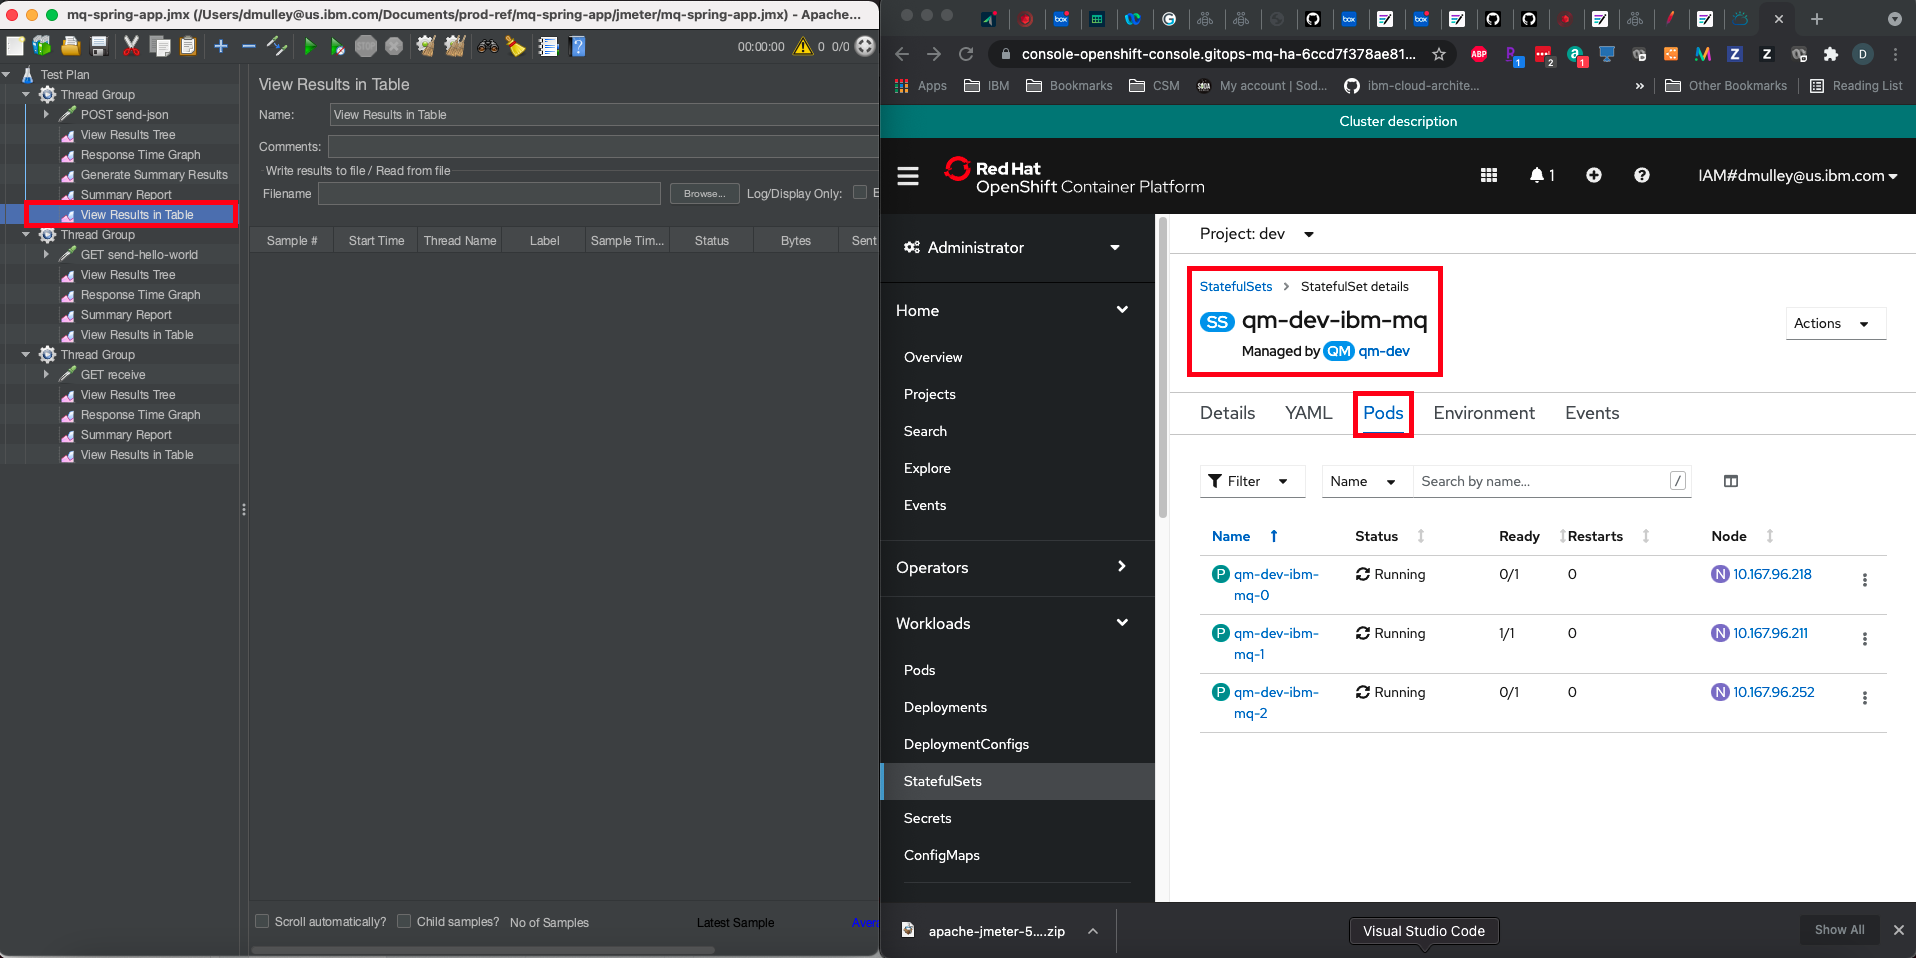
Prepare your screen to execute the test
In order to view the JMeter test while simulating an MQ pod failure, it is necessary to have both JMeter and the OpenShift administration console on your screen at the same time.
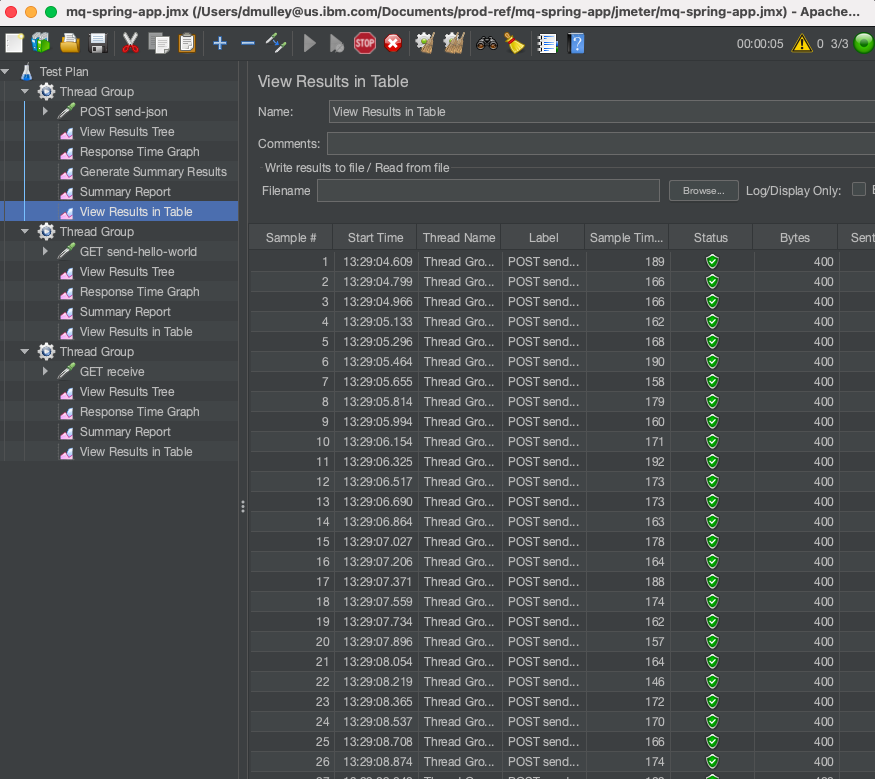
In JMeter UI, select
View Results in Tablefrom the firstThread Groupand select theScroll Automaticallyoption at the bottom of the screen.In OpenShift UI, select the Pods view of the
qm1-ibm-mqStatefulSet.Now configure your screen as shown below:
-
Locate the active MQ pod
Locate the pod that is currently active by finding the one that is
1/1in the Ready column in the OpenShift UI. In this example it isqm1-ibm-mq-1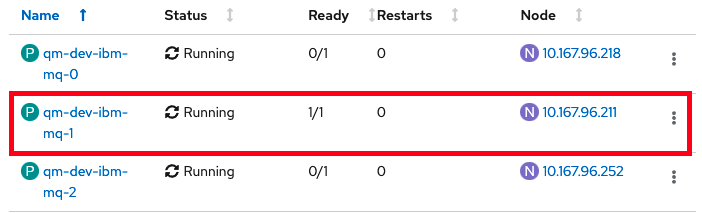
-
Prepare to execute the test
You are now ready to execute the test. In the upcoming steps you will:
- Start the JMeter Test Plan which will send messages to the sample Spring application and on to MQ.
- You will see green successful completions in the JMeter UI.
- Once you see some successful completions you will kill/delete the active MQ pod using the OpenShift UI.
- You will then see red failures in the JMeter UI until one of the other MQ pods becomes active and messages start to be processed successfully.
- The JMeter test will only run for 30 seconds, so you have to be relatively quick.
Now let's run the test
-
Start the JMeter Test
In the JMeter UI, click the Green Start Arrow on the toolbar or click Run --> Start
-
Simulate an outage
Verify that you are seeing some successful responses in the JMeter UI and then delete the active MQ pod using the OpenShift UI
-
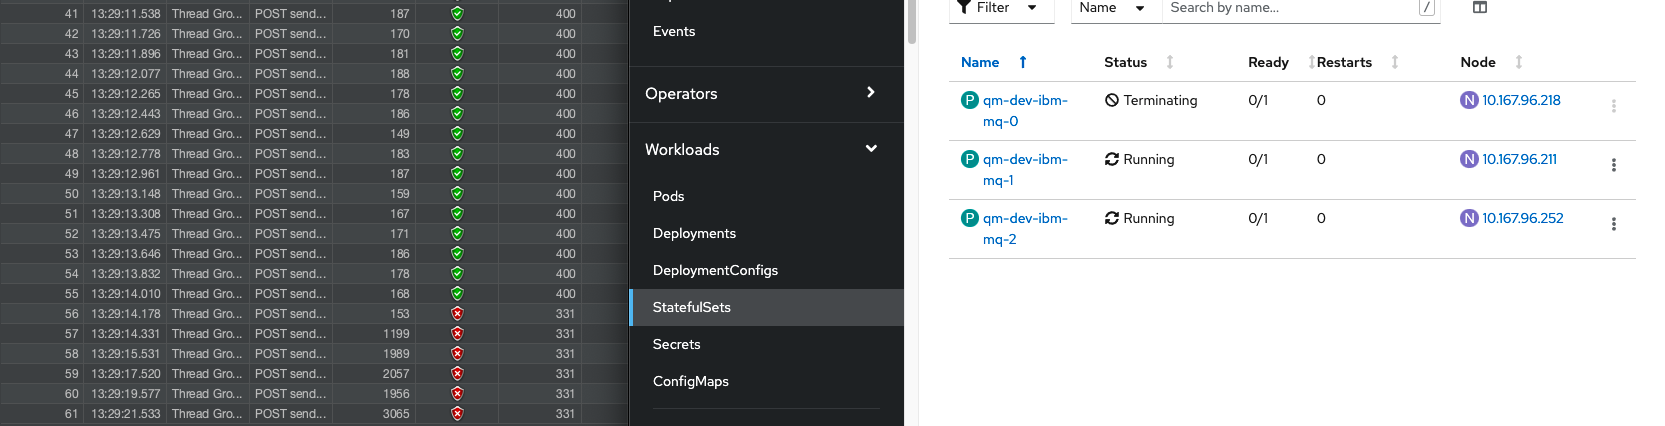
Verify failures
You should now see some failures in the JMeter UI until one of the inactive pods becomes active. In the screen shot below you can see some failures in the JMeter UI as there isn't an active MQ pod to process the messages. It can take up to 5 seconds for MQ to detect that the active pod is gone and to elect a new pod to process the messages,
-
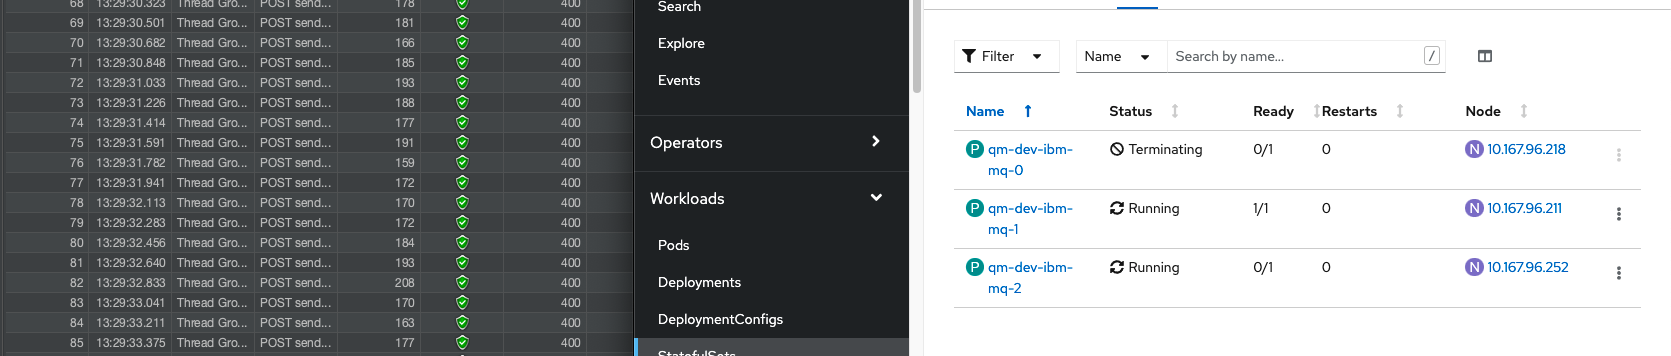
Verify success
Once another MQ pod becomes active the failures in JMeter will stop and messages will return to success as shown below.
As mentioned previously, in Production we would expect the application to handle retrying messages when a failure occurs and to only pass the failure back to the caller if a number of retries are unsuccessful. For this demonstration, it is easier to illustrate the failures in JMeter than it would be inside the application, so we've chosen to immediately reply to the caller with a failure if MQ is unavailable to process the messages.