Promoting from Staging to Prod environment
Overview
Audience: Application developers, Administrators
In the previous topic of this chapter, we ran the promotion pipeline for dev to staging. The pipeline successfully promoted the Queue Manager instance and MQ Sample application instance from dev to staging.
In this topic, you will set up a promotion pipeline that promotes the Queue Manager and MQ sample application from staging environment to prod environment. We'll activate the ArgoCD application that will watch the GitOps folder containing the kubernetes resources and use it and its dependent resources to deploy a running queue manager and sample application to the prod namespace in the cluster.
Look at the following diagram:

We've highlighted the components we're going to explore in this topic:
- The
promotion pipeline from staging to prodwill perform a set of tasks for performance testing. If successful, the pipeline leaves a PR in the GitOps apps repository. - The
GitOps apps repositorywill have a PR for the latest good build and test represented as kubernetes resources forprodenvironment. These resources will be subsequently used by ArgoCD to deploy to the cluster. - An
ArgoCD applicationwill monitor the GitOps folder where its kubernetes resources are held. Whenever this folder is updated, this ArgoCD application will apply these updates to the cluster, resulting in a new deployment. - The instance of
Queue Managerrunning in the cluster is active prod queue manager ready for use by MQ applications under prod. - The instance of
MQ Sample Applicationrunning in the cluster is active prod sample application under prod.
In this topic, we're going to:
- Access the promotion pipeline
- Run the promotion pipeline for
Queue Manager - Run the promotion pipeline for
MQ Sample Application - Explore the promotion pipeline.
- Activate ArgoCD application for
Queue ManagerandMQ Sample Applicationfor prod namespace. - Review the resultant GitOps application folders for
Queue ManagerandMQ Sample Application. - Examine the activated ArgoCD application that deploys the
Queue ManagerandMQ Sample Applicationto the cluster. - Validate
Queue ManagerandMQ Sample Application.
By the end of this topic we'll have a fully functioning staging to prod promotion pipeline that we can use to promote queue manager and sample application from staging environment to prod environment.
Pre-requisites
Before attempting this topic, you should have successfully completed the previous chapter.
Access the promotion pipeline
As we can see in the diagram above, the promotion pipeline is responsible for promoting the Queue Manager and MQ Sample application from staging to prod. If successful, it leaves a PR with the updated resources for prod in the GitOps apps repository, which are used by ArgoCD to deploy the updated Queue Manager and application to the cluster.
It's usually the case a pipeline runs automatically when the Queue Manager or the Sample application is successfully deployed in staging environment. However, our first pipeline run is manual so that you can be in control, making it easier to understand what's happening.
-
Locate the
cipipelines in the web consoleLet's find the promotion pipeline using the OpenShift web console.
Navigate to
Pipelines->Pipelinesin the left hand pane, and selectProject: ci, to show all pipelines in thecinamespace: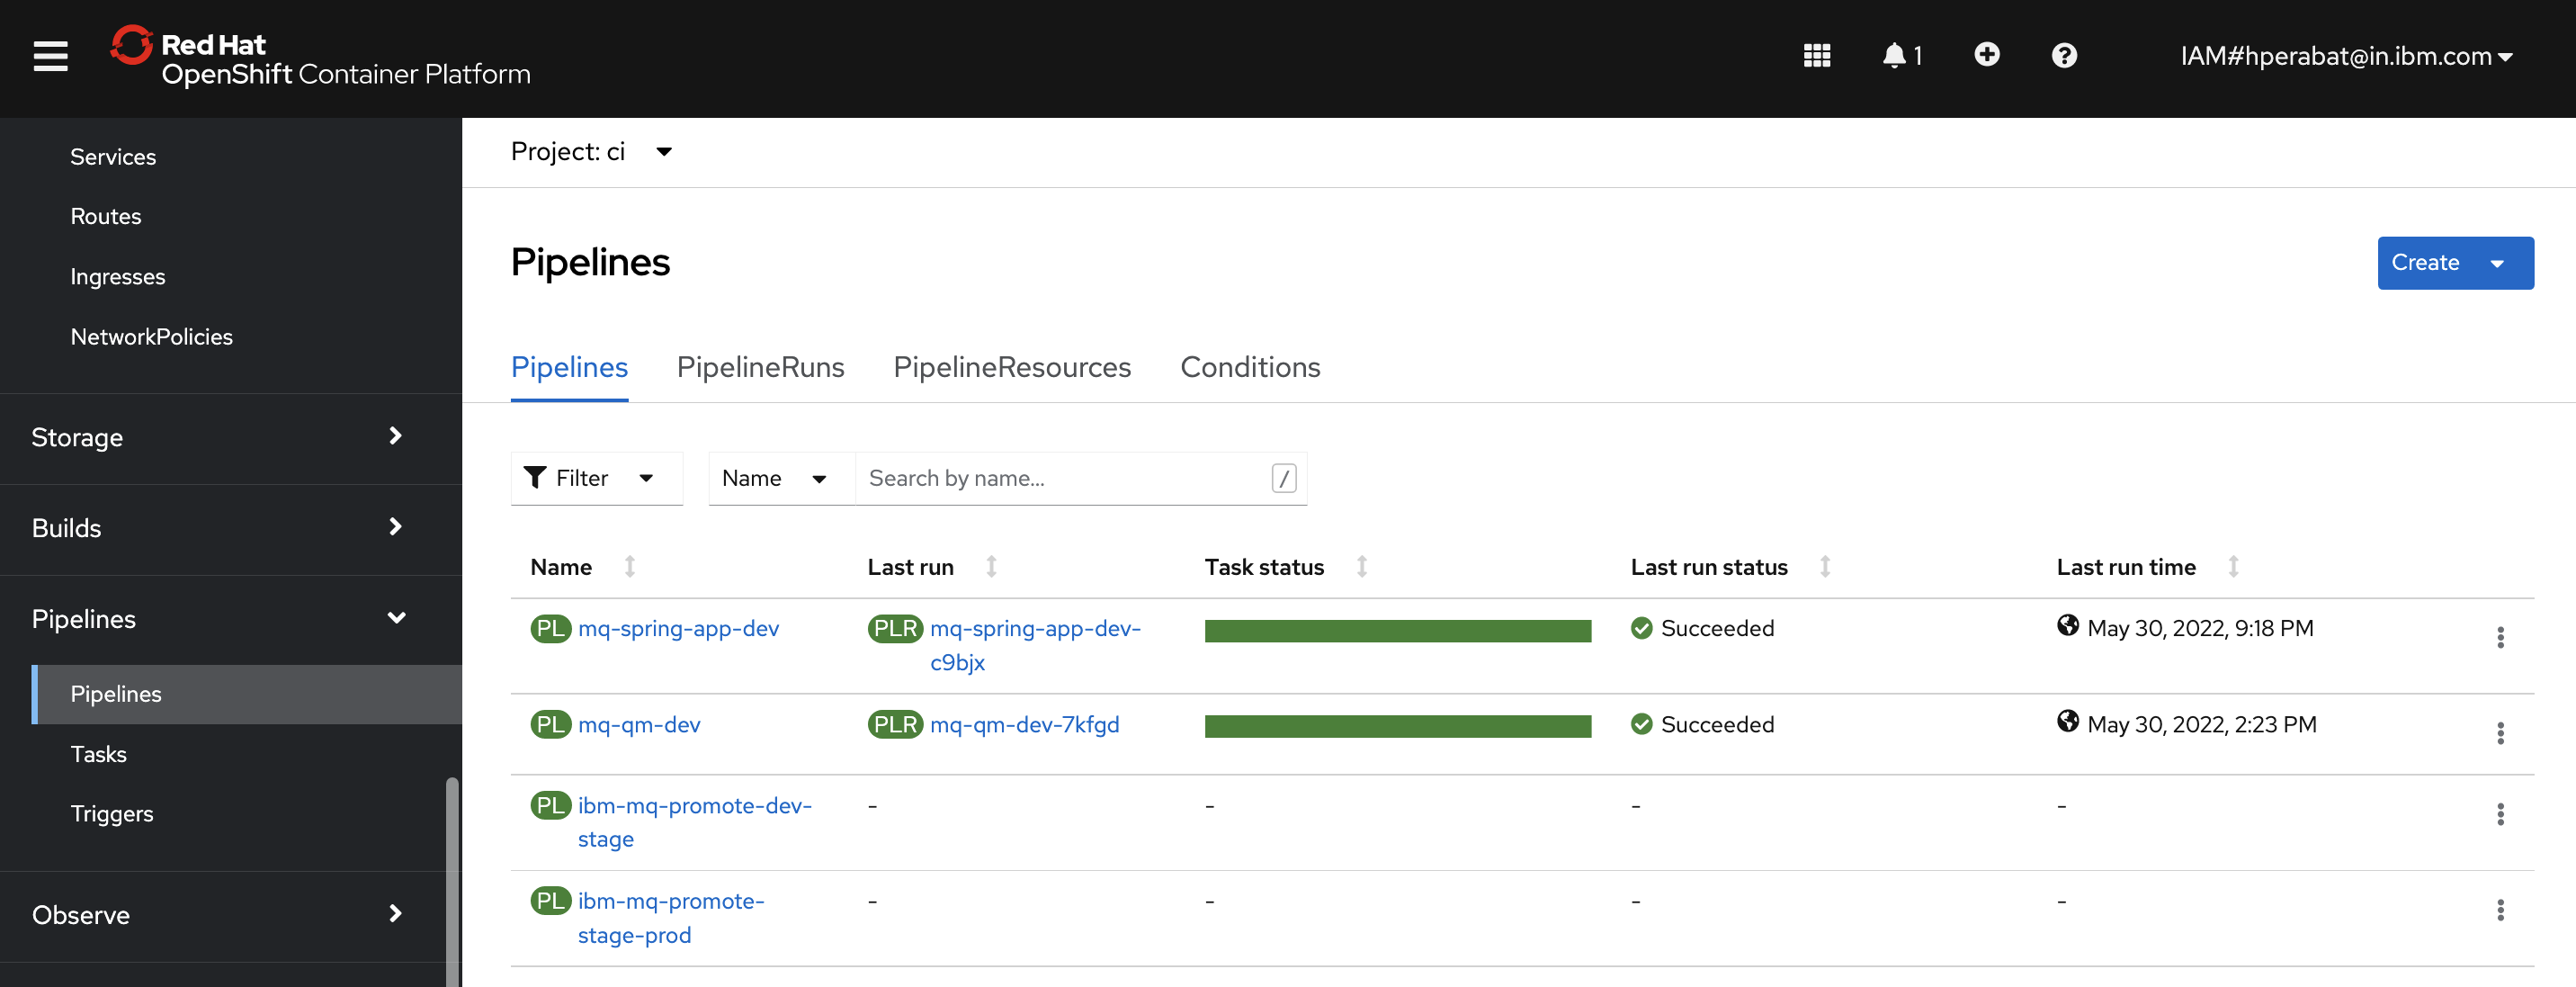
You can see all the pipelines that we installed into the
cinamespace in the previous chapter. We'll use different pipelines for different activities throughout the tutorial.For this topic, we're going to use the
ibm-mq-promote-stage-prodpipeline. When theQueue ManagerorSample applicationare successfully deployed to thestagingnamespace, this pipeline will perform performance testing and on a successful run, it will promote the existing resources instagingto theprodnamespace. -
The
ibm-mq-promote-stage-prodpromotion pipelineSelect the
ibm-mq-promote-stage-prodpipeline from the list of all pipelines: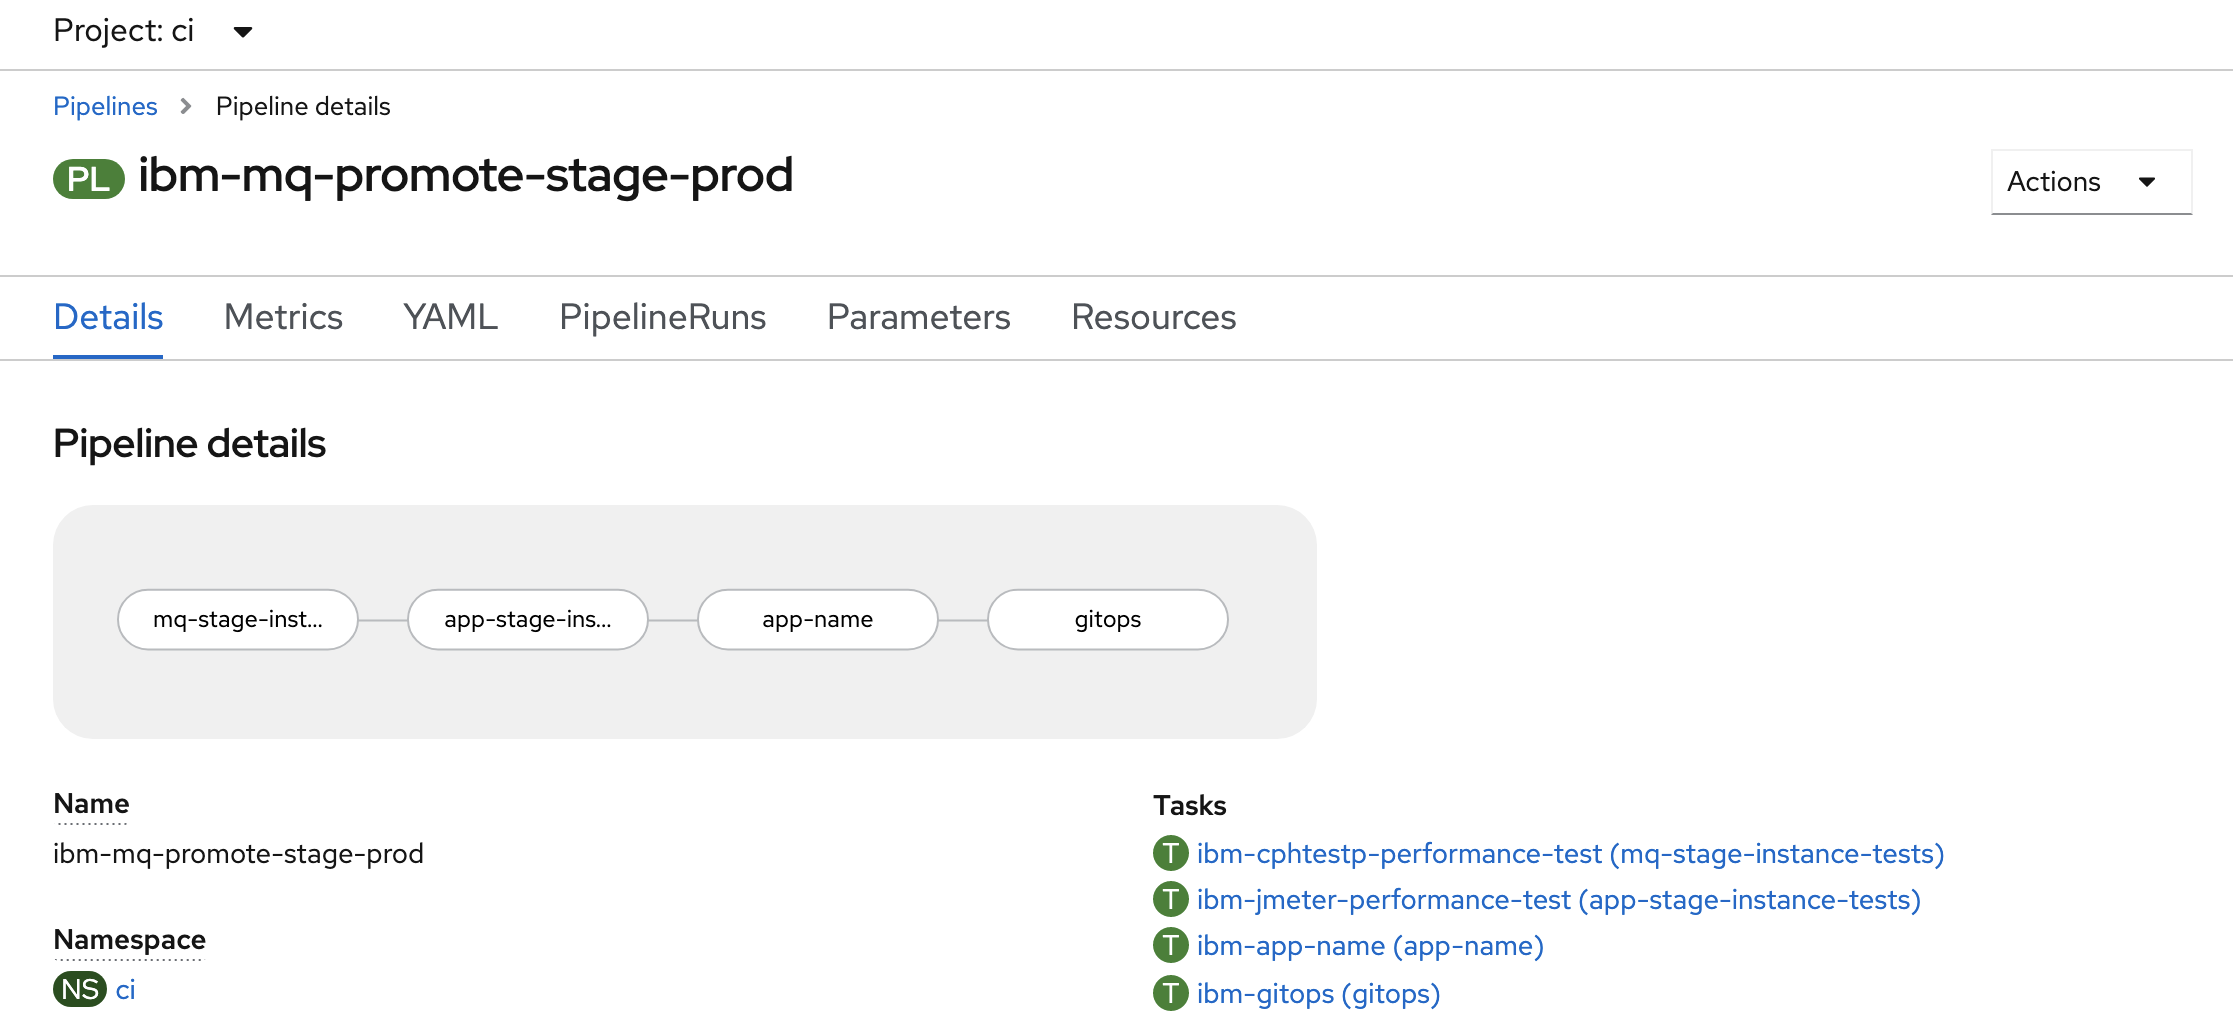
Like all pipelines,
ibm-mq-promote-stage-prodis composed from a set of tasks:mq-stage-instance-testsapp-stage-instance-testsapp-namegitops
The task name often provides a strong hint of each task's specific function. We'll examine these tasks in detail as the pipeline runs.
-
The
occommand as an alternative to the Web consoleAs well as using the OpenShift web console, you can also interact with pipeline using the
ocortektoncommands.Ensure you're logged in to cluster, and issue the following command to list the
ibm-mq-promote-stage-prodpipeline details:oc get pipeline ibm-mq-promote-stage-prod -n ciwhich shows a brief summary of the pipeline:
NAME                        AGE
ibm-mq-promote-stage-prod   5d18h
You can get more detail by adding the
-o yamloption; we'll do that later.
Run the promotion pipeline
Queue Manager
-
Configure your first pipeline run
In
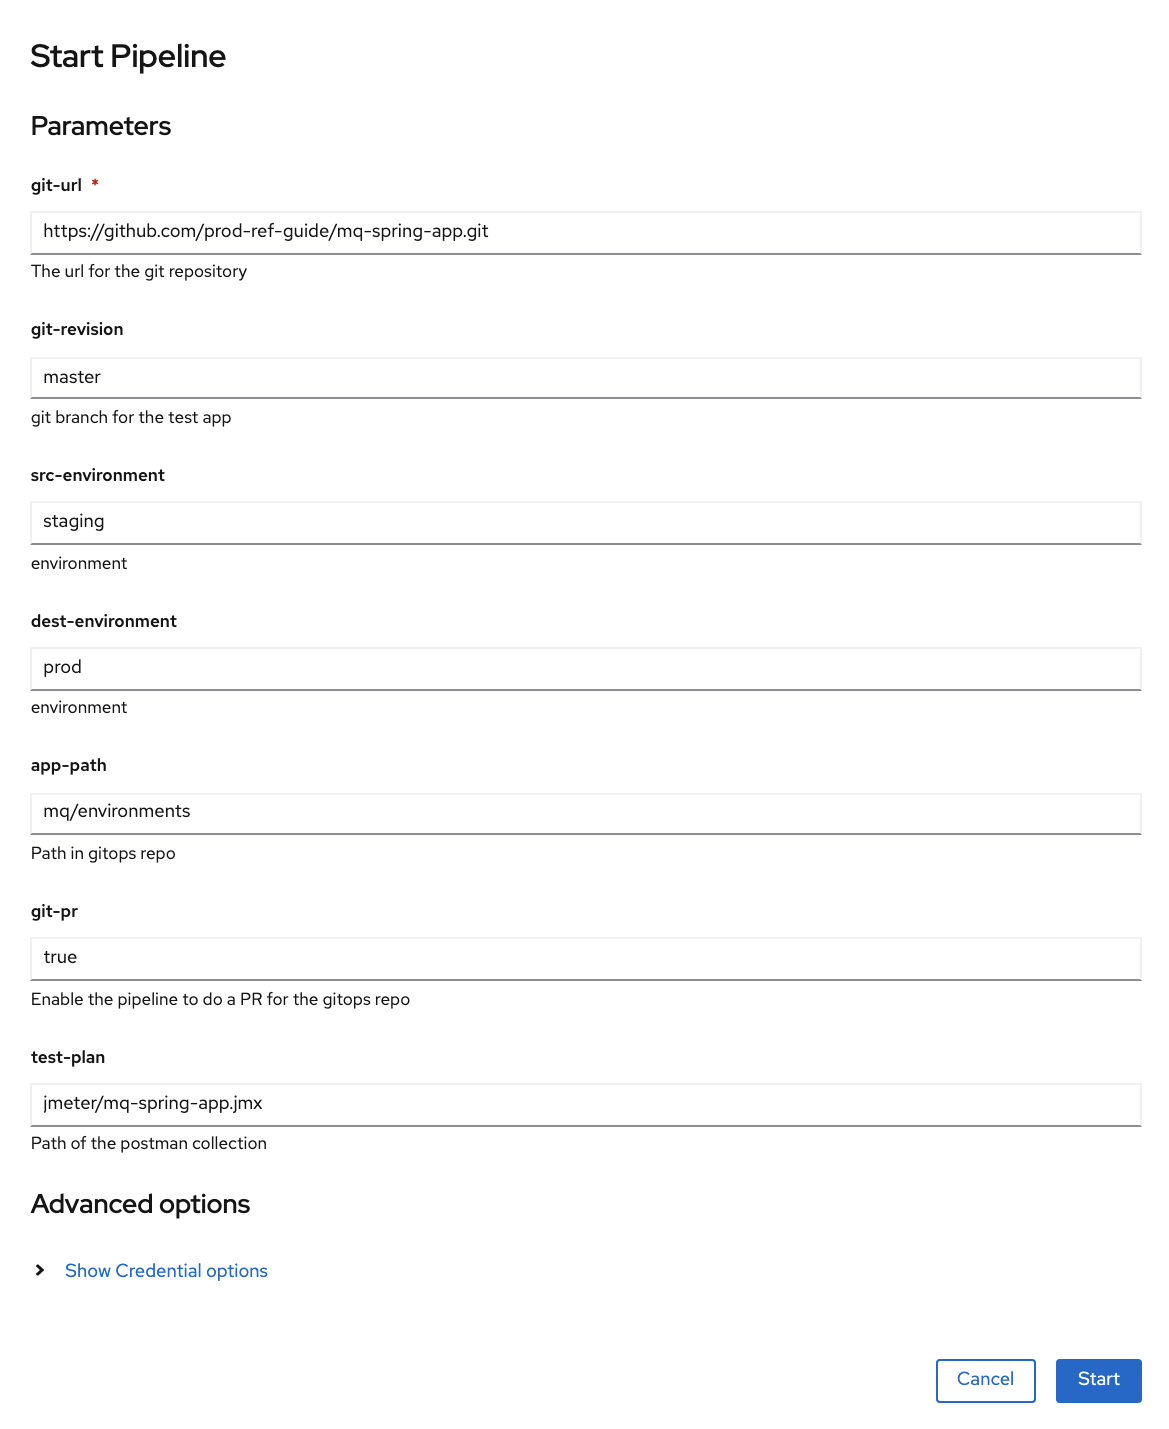
pipeline detailsview above, you'll see anActionsbutton. SelectStartto configure a pipeline run.You'll be presented with the following dialog:
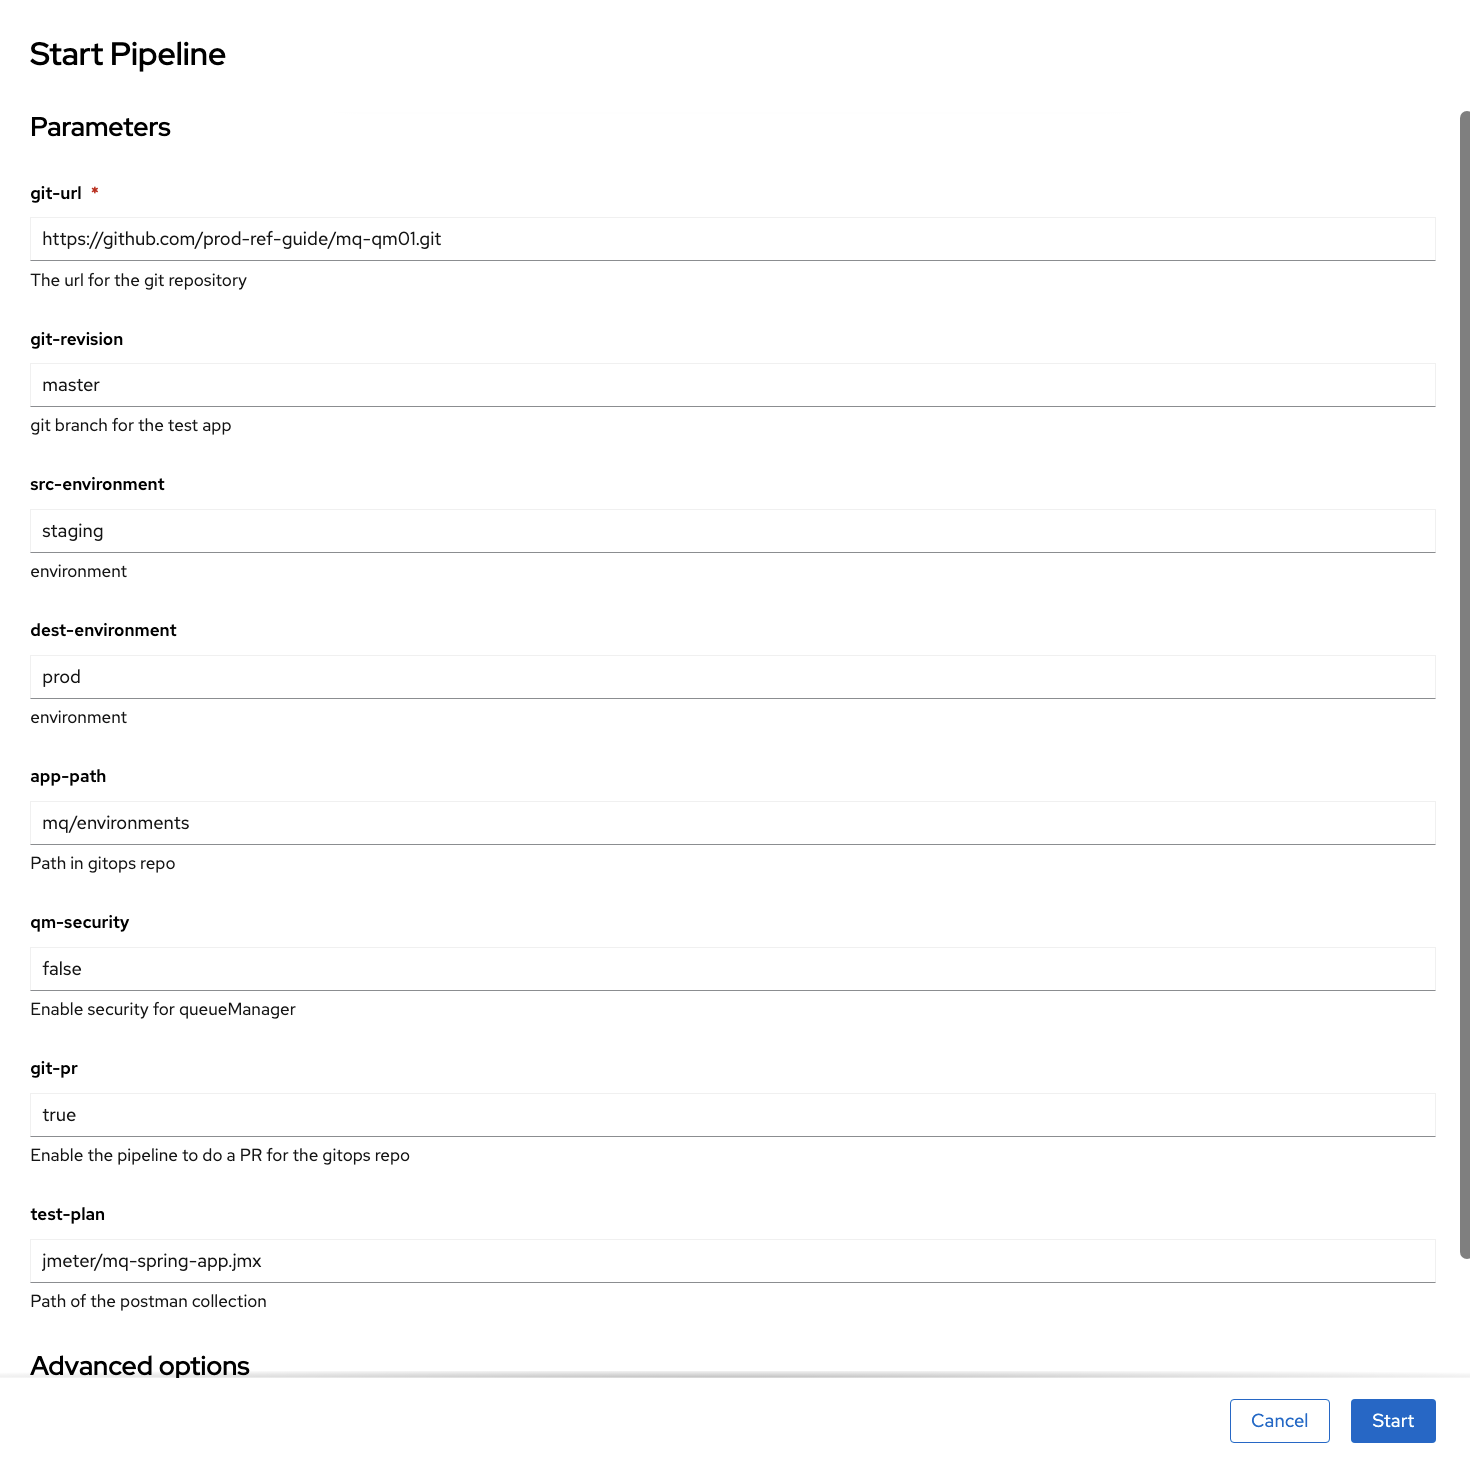
The supplied arguments allow the user of the pipeline to configure its behavior. For example, a user can use this pipeline with different queue manager source repositories.
Configure the run as follows:
- Set
git-urlto the clone of themq-qm01repository - Set
git-revisiontomaster. - Set
src-environmenttostaging. - Set
dest-environmenttoprod. - Set the
app-pathpointing to yourGitOps apps repositorywhich in our case ismq/environments. - Set the
qm-securityas per your Queue Manager security settings. By default it is set tofalseand assumes the Queue Manager is non-secure. - Set
git-prtotrue. - Set
test-filepointing to yourjmeter jmx file. If your source repository don't have any jmx file defined, just leave the defaults.
Note
At the moment, Queue Manager
mq-qm01repository do not have any performance tests defined using Jmeter, but the performance tests are being run using the cphtestp tool. Also, this pipeline is designed in a way to skip this tests if the definitions are not present. However, MQ Sample applicationmq-spring-apprepository have jmeter tests defined and we will be coming across it in the later section of this tutorial.Hit
Startto start the pipeline run.You can also use the command line to run a pipeline; we'll explore that option later.
- Set
-
Watch a pipeline run executing
The pipeline run has now started.
Notice how the view changes to
Pipeline Run details: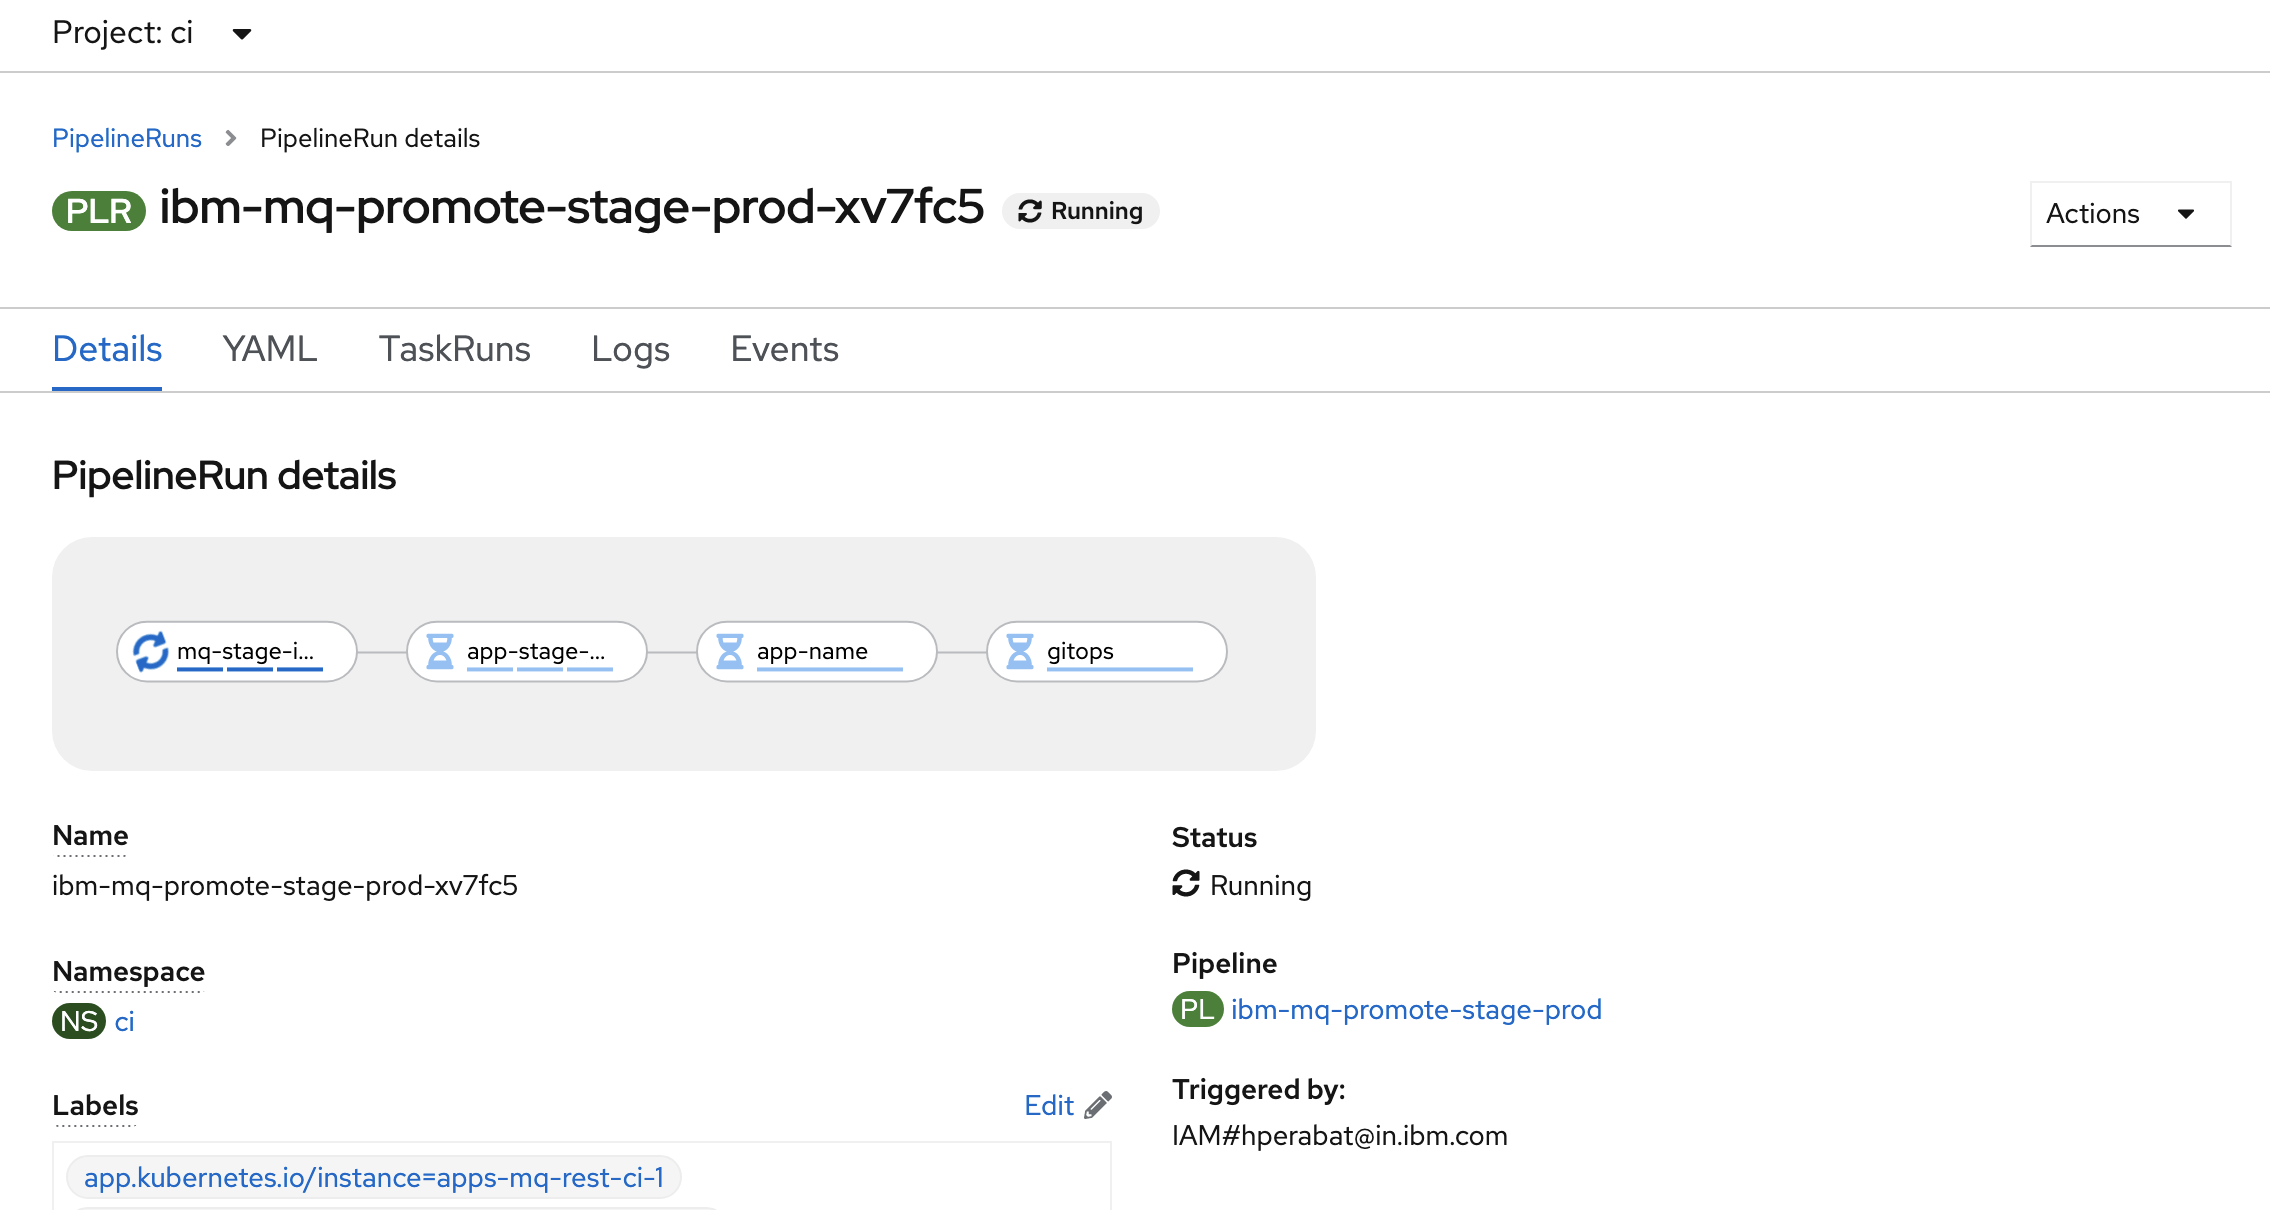
We're now looking at the live output from a pipeline run, rather than the pipeline used to create the run.
Notice that the pipeline run name
ibm-mq-promote-stage-prod-xv7fc5is based on the pipeline name -- with a unique suffix. Every new pipeline run will have a unique name.See also how the first
mq-stage-instance-teststask is running, while the remaining tasks are waiting to start.Hover over
mq-stage-instance-teststask and you will see the steps that comprise it. -
Watch pipeline steps complete
As the pipeline run proceeds, notice all the steps got completed:

This pipeline will take a while for about 40 to 50 minutes to complete.
MQ Sample Application
-
Configure your first pipeline run
In
pipeline detailsview above, you'll see anActionsbutton. SelectStartto configure a pipeline run.You'll be presented with the following dialog:
The supplied arguments allow the user of the pipeline to configure its behavior. For example, a user can use this pipeline with different sample application source repositories.
Configure the run as follows:
- Set
git-urlto your fork of themq-spring-apprepository - Set
git-revisiontomaster. - Set
src-environmenttostaging. - Set
dest-environmenttoprod. - Set the
app-pathpointing to yourGitOps apps repositorywhich in our case ismq/environments. - Leave the defaults for
qm-security. By default it is set tofalse. - Set
git-prtotrue. - Set
test-planpointing to yourjmeter jmx file. If your source repository don't have any jmx file, just leave the defaults.mq-spring-apprepository have the jmx file defined atjmeter/mq-spring-app.jmxusing Jmeter.
Hit
Startto start the pipeline run.You can also use the command line to run a pipeline; we'll explore that option later.
- Set
-
Watch a pipeline run executing
The pipeline run has now started.
Notice how the view changes to
Pipeline Run details: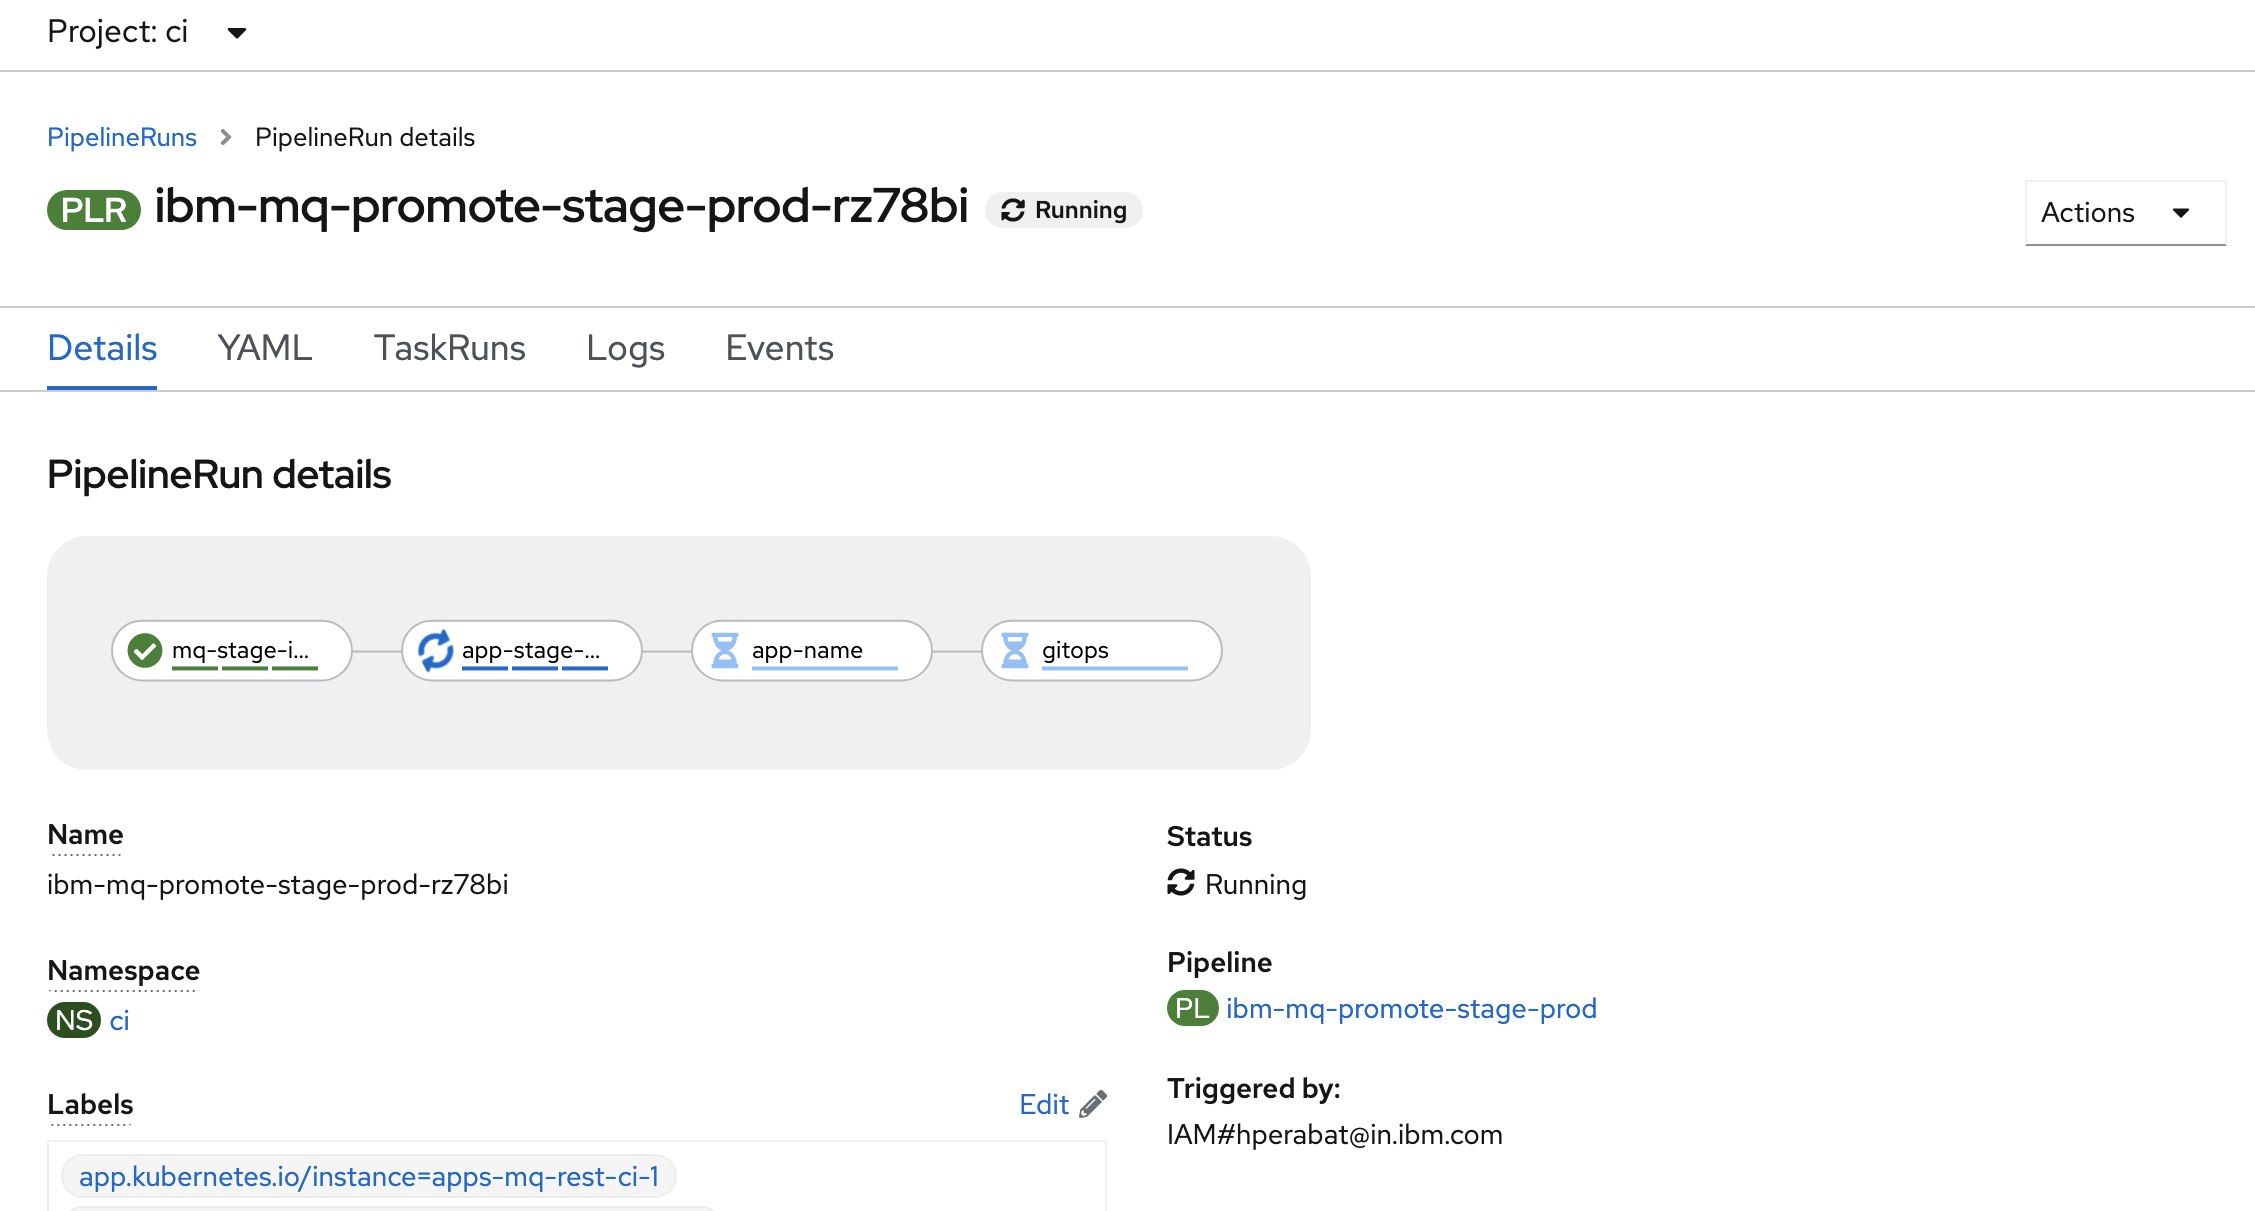
We're now looking at the live output from a pipeline run, rather than the pipeline used to create the run.
Notice that the pipeline run name
ibm-mq-promote-stage-prod-rz78biis based on the pipeline name -- with a unique suffix. Every new pipeline run will have a unique name.See also how the second
app-stage-instance-teststask is running, while the remaining tasks are waiting to start.Hover over
app-stage-instance-teststask and you will see the steps that comprise it. -
Watch pipeline steps complete
As the pipeline run proceeds, notice all the steps got completed:
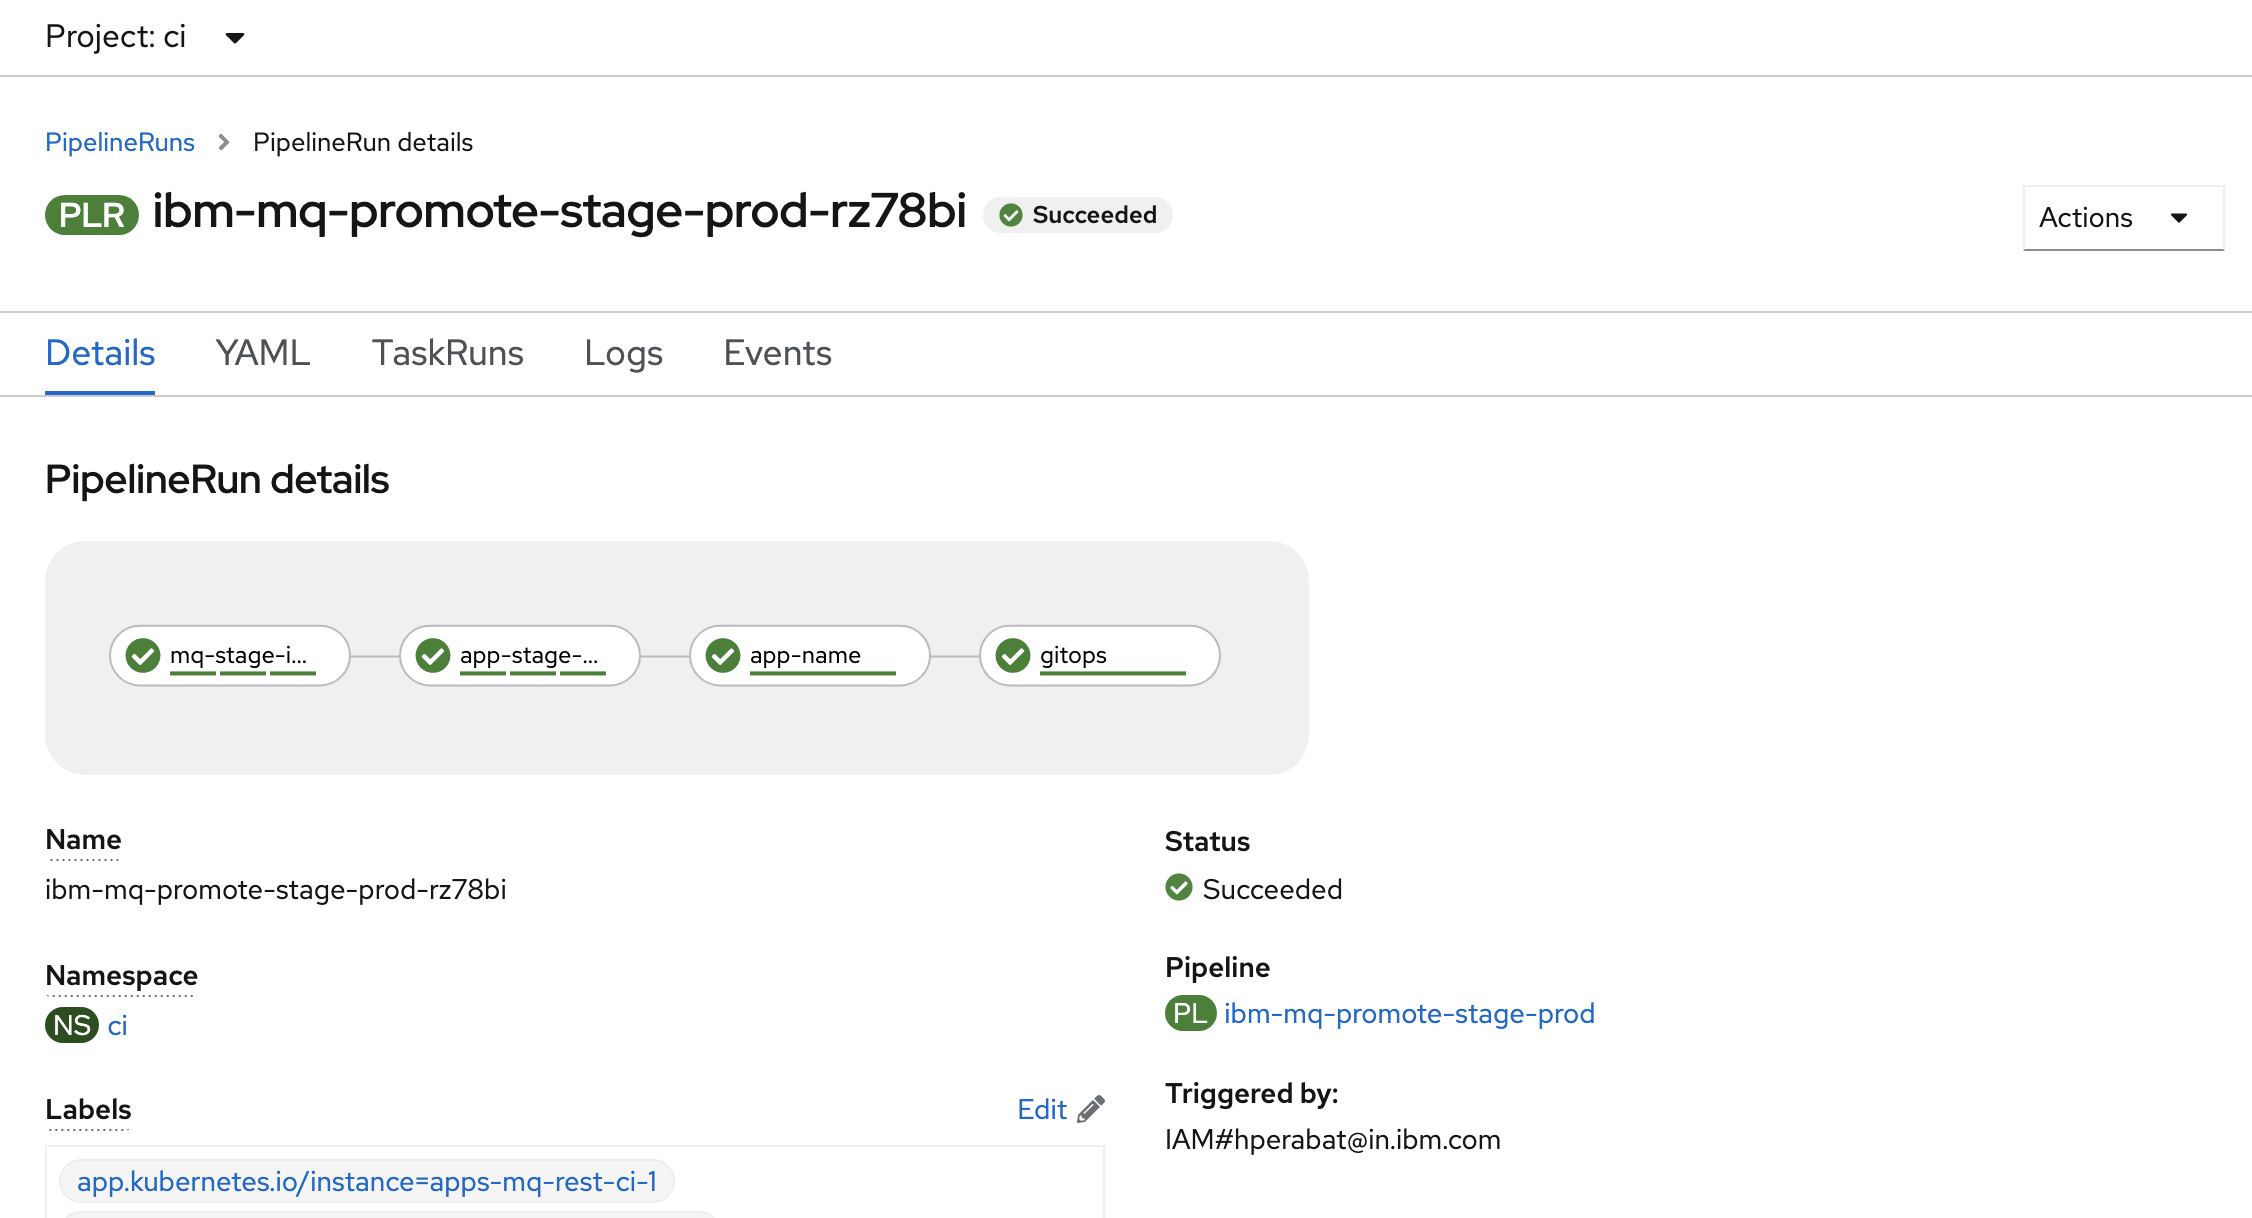
This pipeline will take about a minute or two to complete.
Explore the promotion pipeline
Let's look more closely at how the ibm-mq-promote-stage-prod pipeline is structured. Let's also examine the tasks and steps that make up the pipeline, and how they progressively validate the deployments in staging namespace, resulting in the production of kubernetes resources ready for deployment in prod namespace.
Queue Manager
-
Pipeline, Task, Step
Let's start with the pipeline, its tasks and steps.
Hover over the
mq-stage-instance-teststask: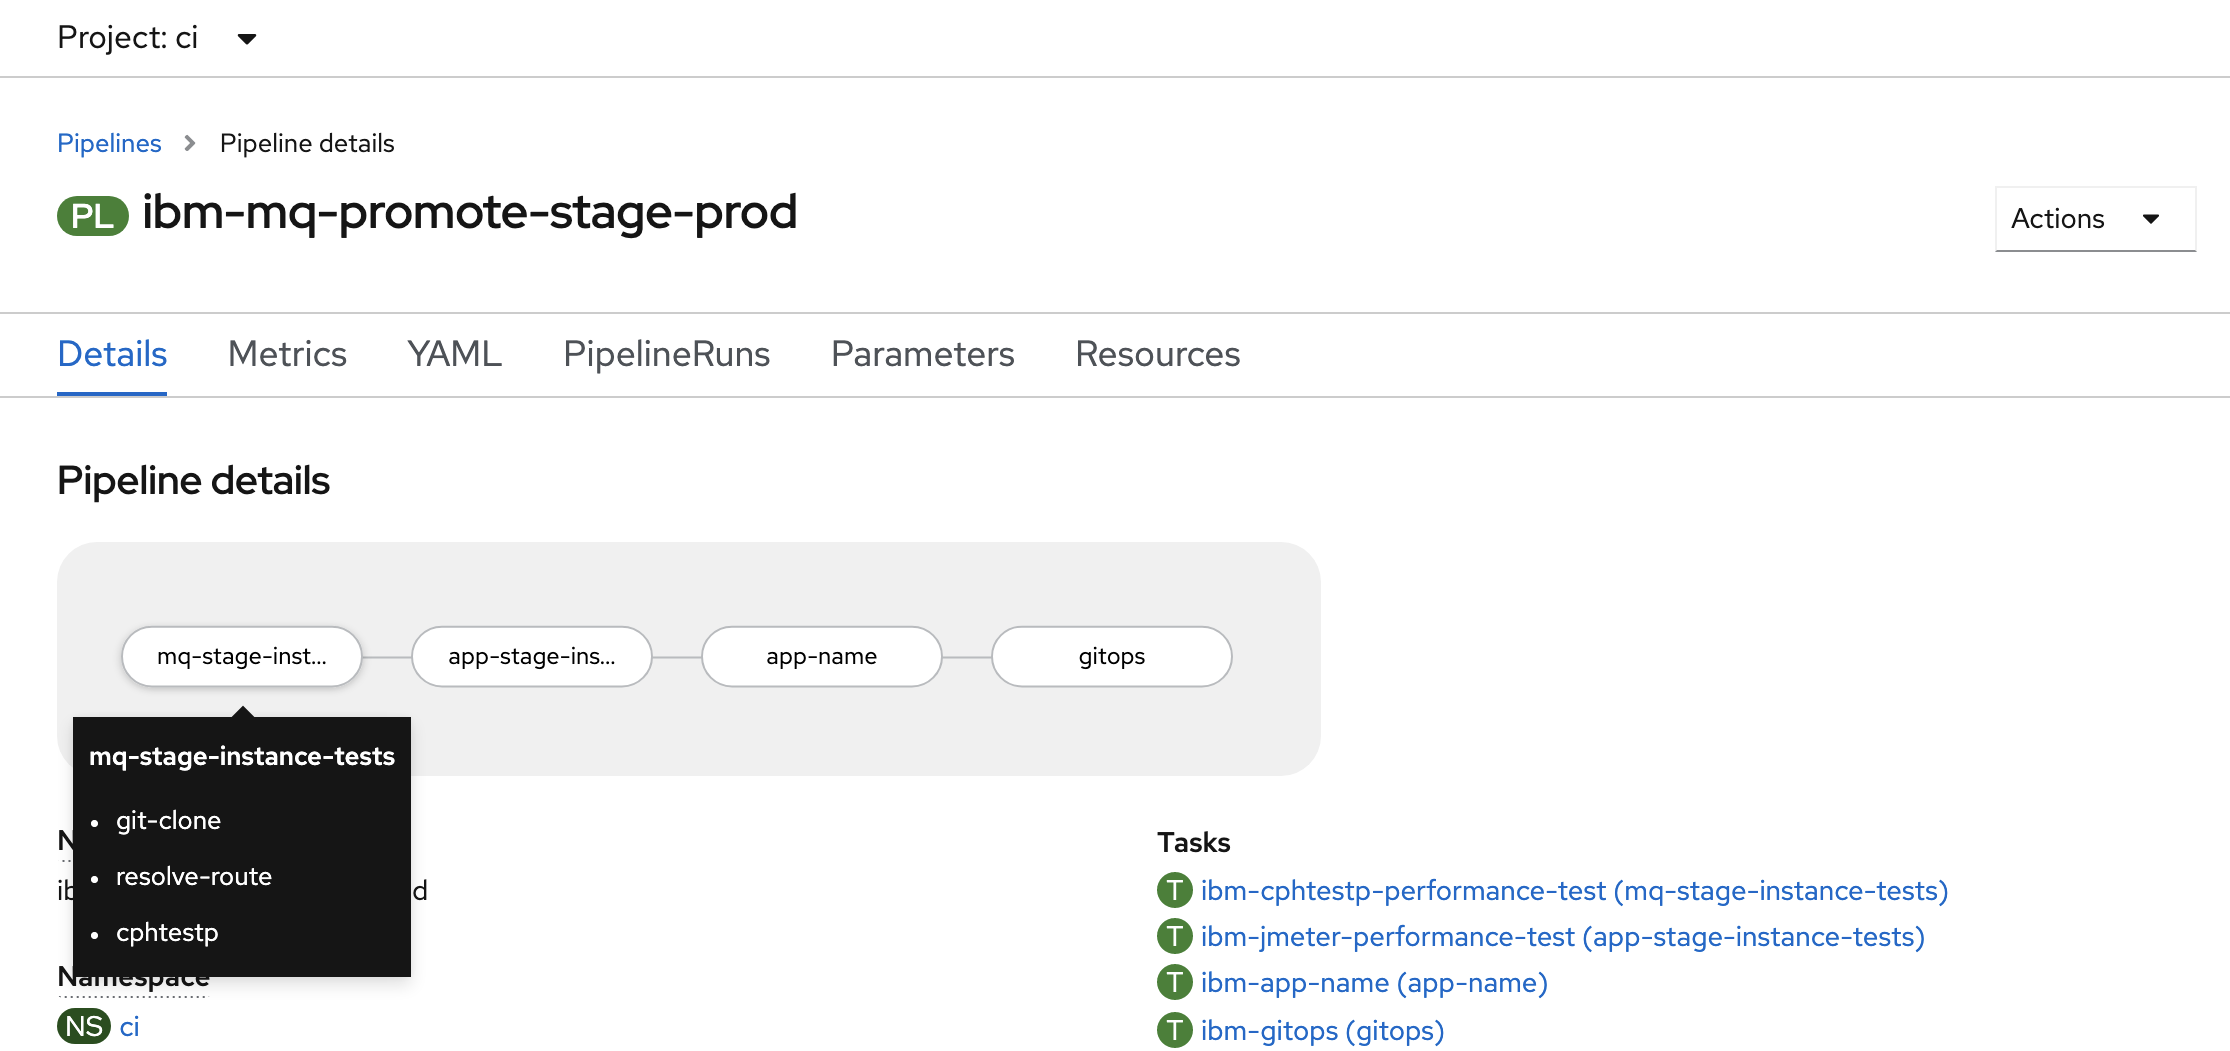
See how our pipeline is made up of tasks such as
mq-stage-instance-tests,app-stage-instance-tests,app-nameandgitops. These run in the order defined by the pipeline. Our pipeline is linear, though Tekton supports more sophisticated pipeline graphs if necessary.See how each task comprises a set of steps such as
git-cloneorsetup. These run in the order defined by the task. -
The pipeline run logs
When a pipeline runs, all its output is captured in a set of logs, one for each task.
Click on the
mq-stage-instance-teststask to show its logs: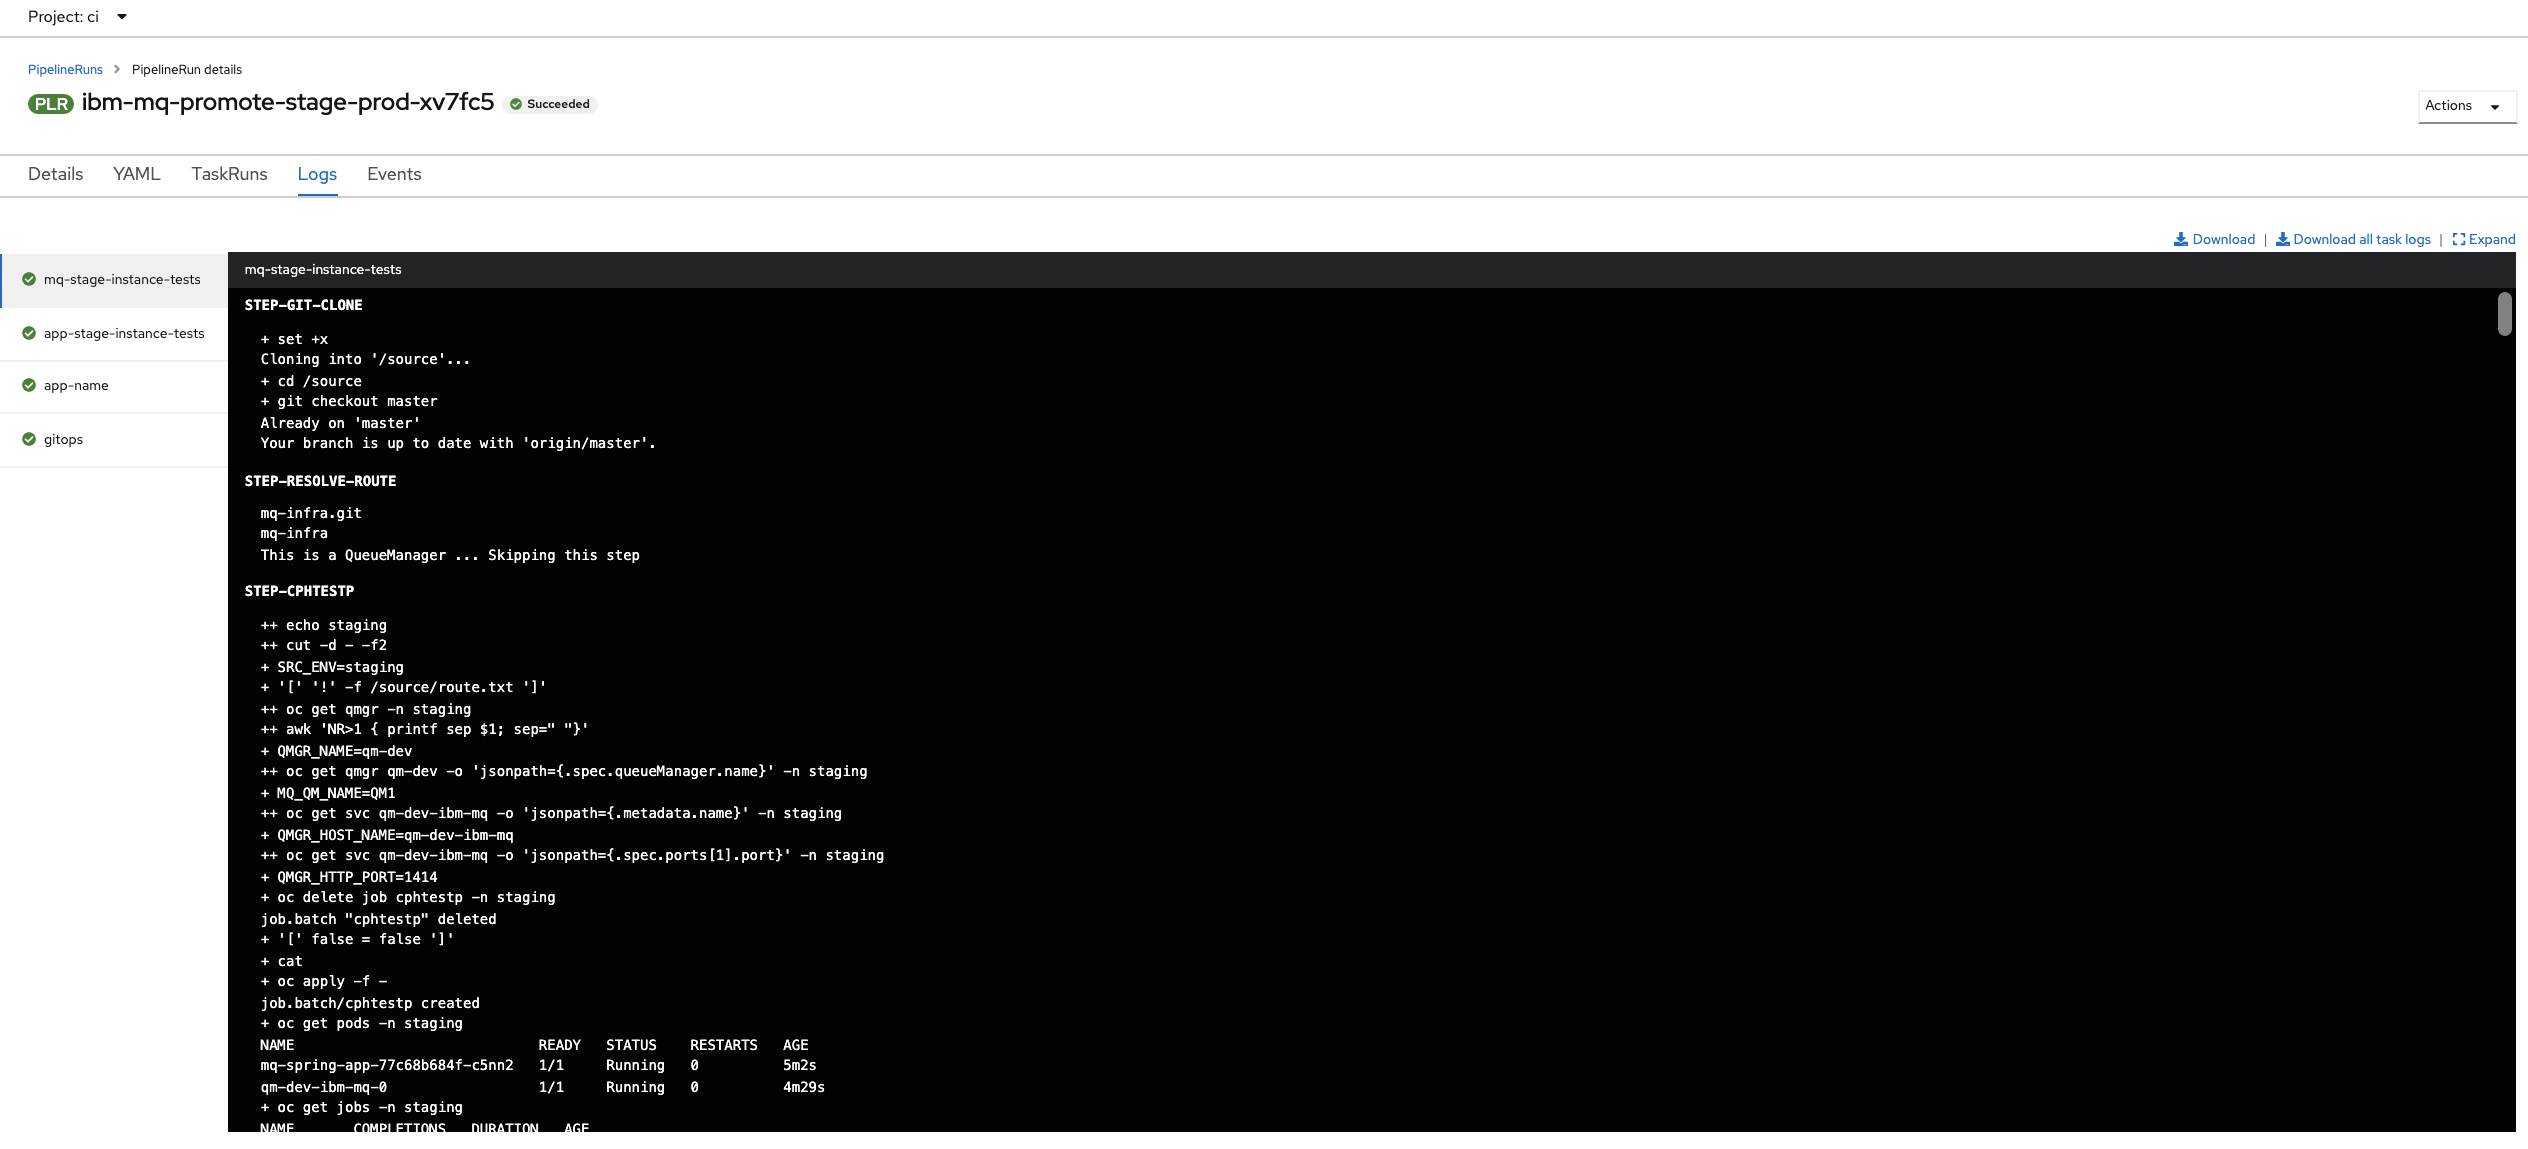
(Alternatively, you can select the
Logstab from the UI, and then select the tasks on the left pane within the pipeline run view.)See how the
mq-stage-instance-teststask has its output in a dedicated log. You can select any log for any task that has completed or is executing. When a pipeline run completes, all its logs remain available, which can help diagnosing problems for example. -
Exploring an example task output:
mq-stage-instance-testsIt's easy to examine a task log; you simply select the relevant task and scroll the log up or down. For active tasks the log will be dynamically updated.
Click on the
mq-stage-instance-teststask: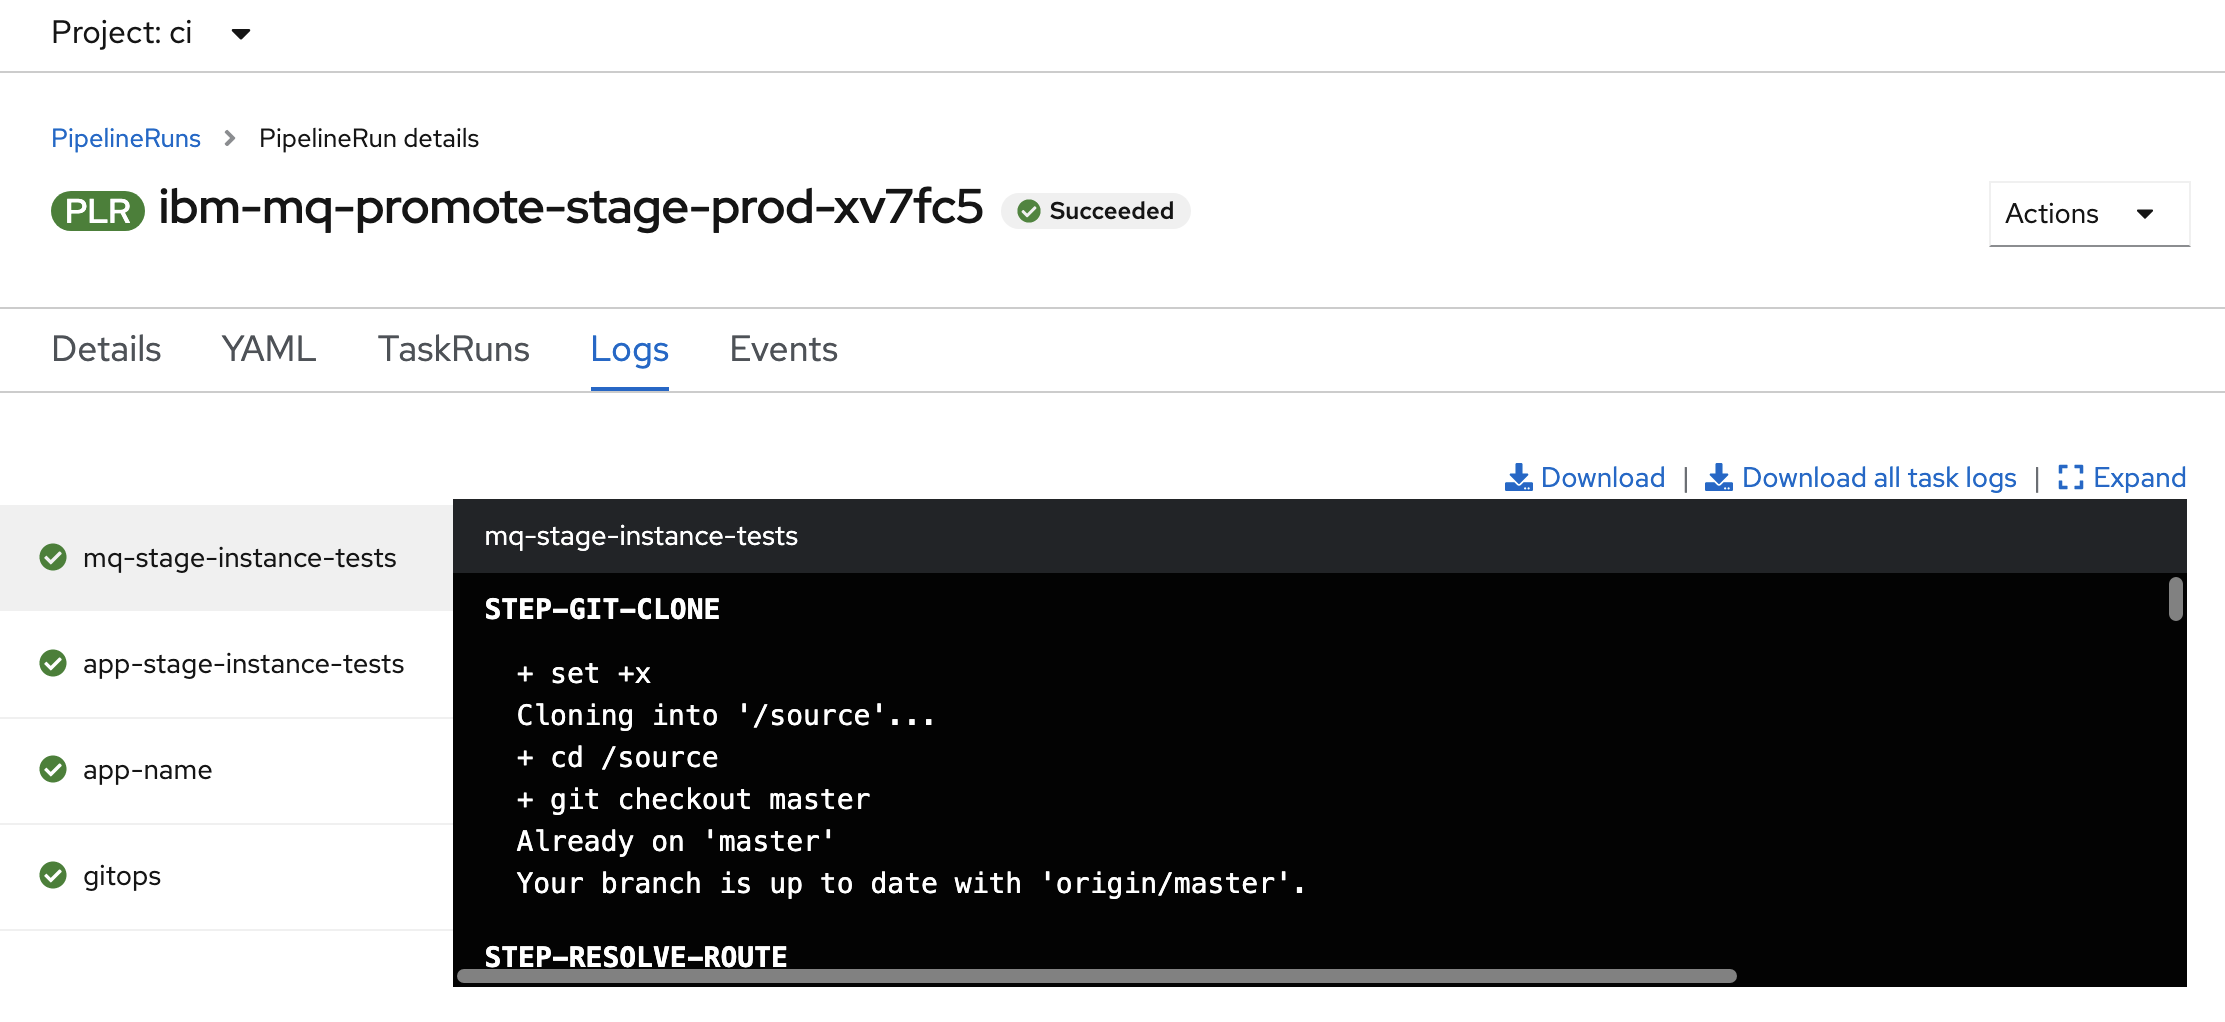
This console window shows the output generated by
mq-stage-instance-teststask. As the task script proceeds, its output is captured; that's what we can see in this window.Notice that the
mq-stage-instance-teststask output is from the first step in themq-stage-instance-teststask. This step is calledSTEP-GIT-CLONE. Note how the step names are capitalized in the web console output.Let's look at another task and its steps more closely.
-
Exploring a task step in detail:
STEP-CPHTESTPA task is built of multiple steps. Let's explore the
mq-stage-instance-teststask and itsstep-cphtestpstep.Select the
mq-stage-instance-teststask and scroll through its logs to see its third step,STEP-CPHTESTP: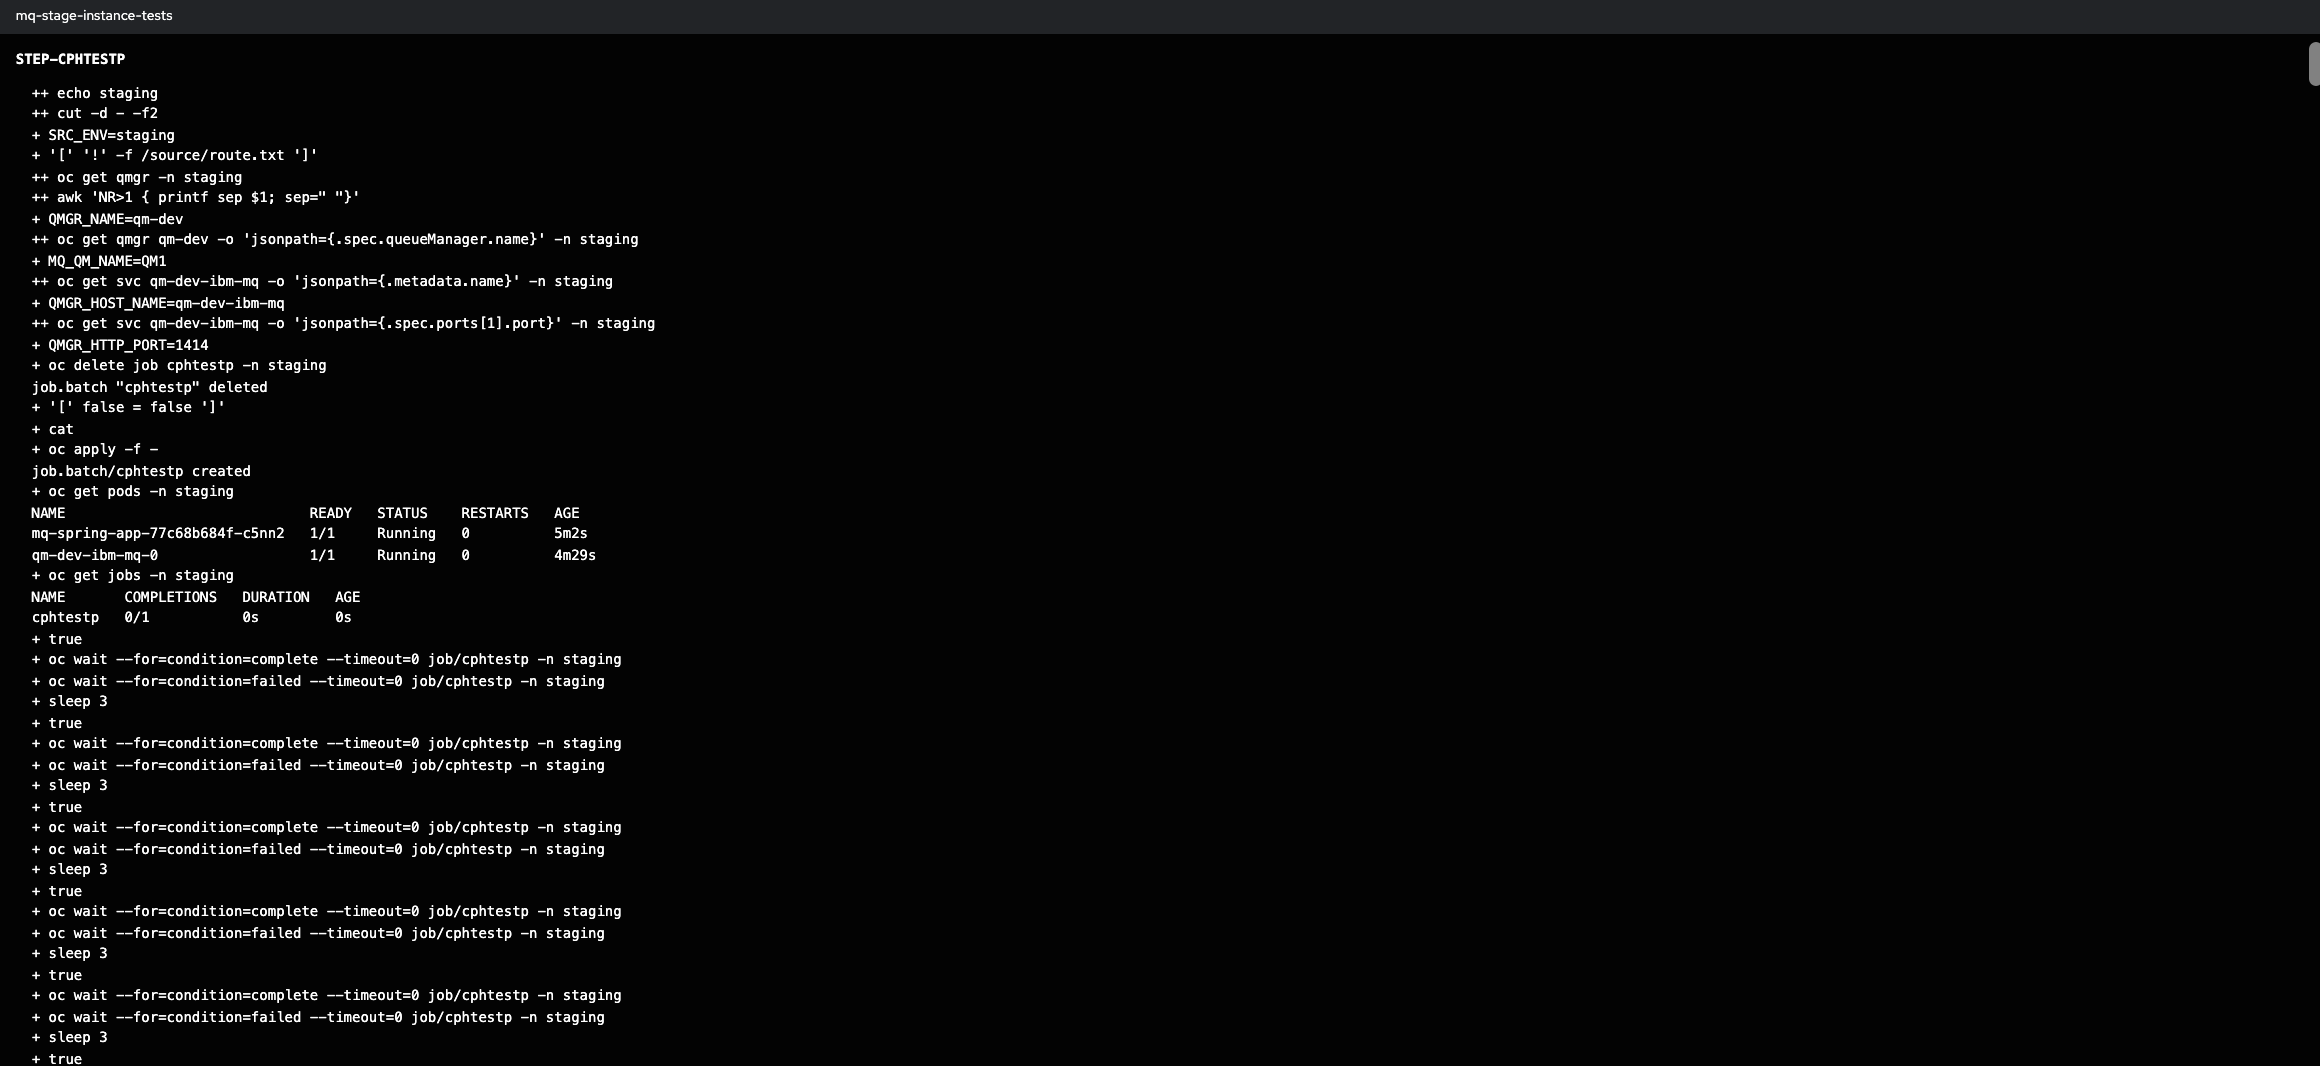
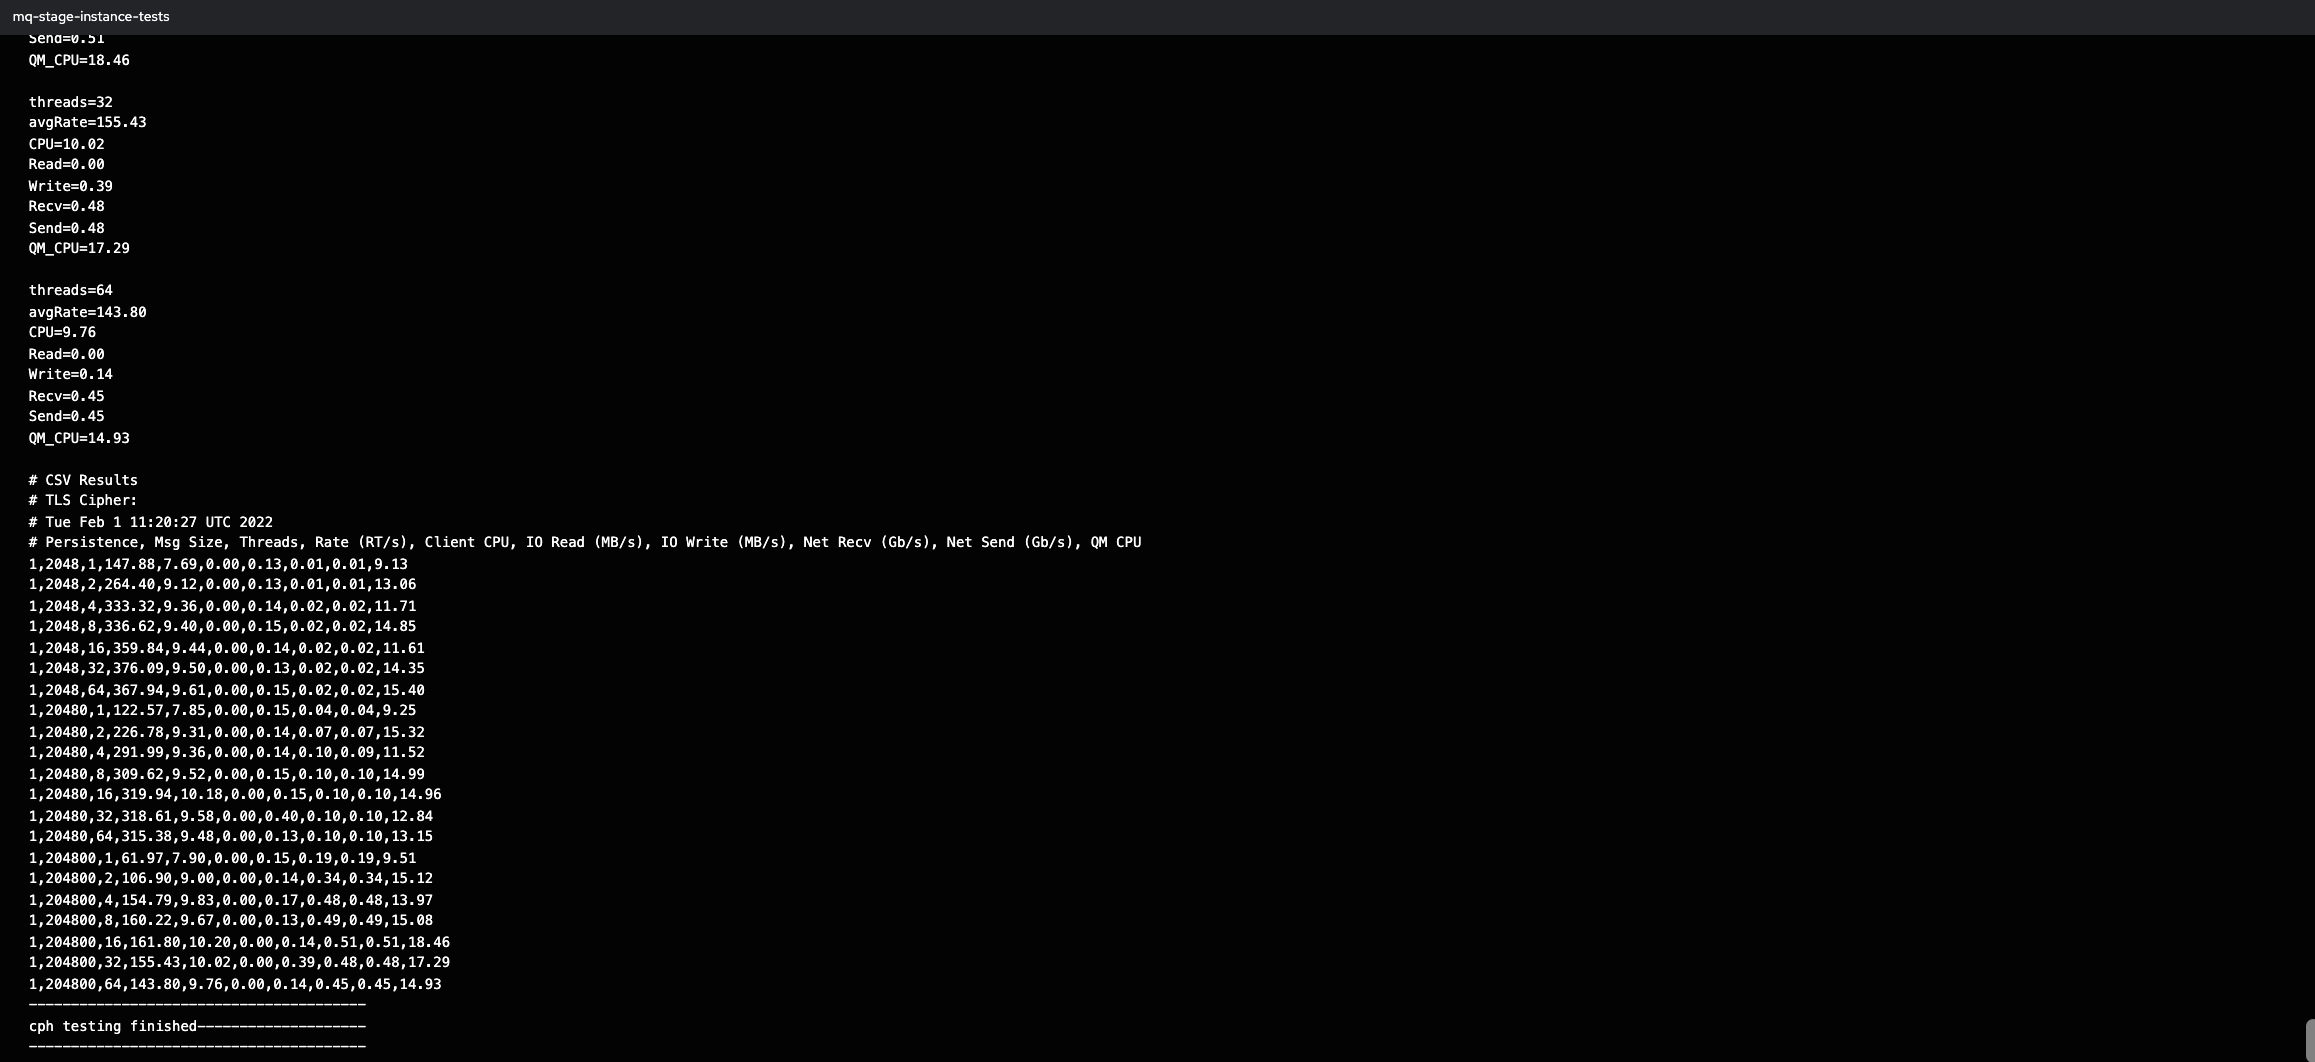
See how the
step-cphtestpoutput is captured in the same log as the previous stepgit-clone.
MQ Sample Application
-
Pipeline, Task, Step
Let's start with the pipeline, its tasks and steps.
Hover over the
app-stage-instance-teststask: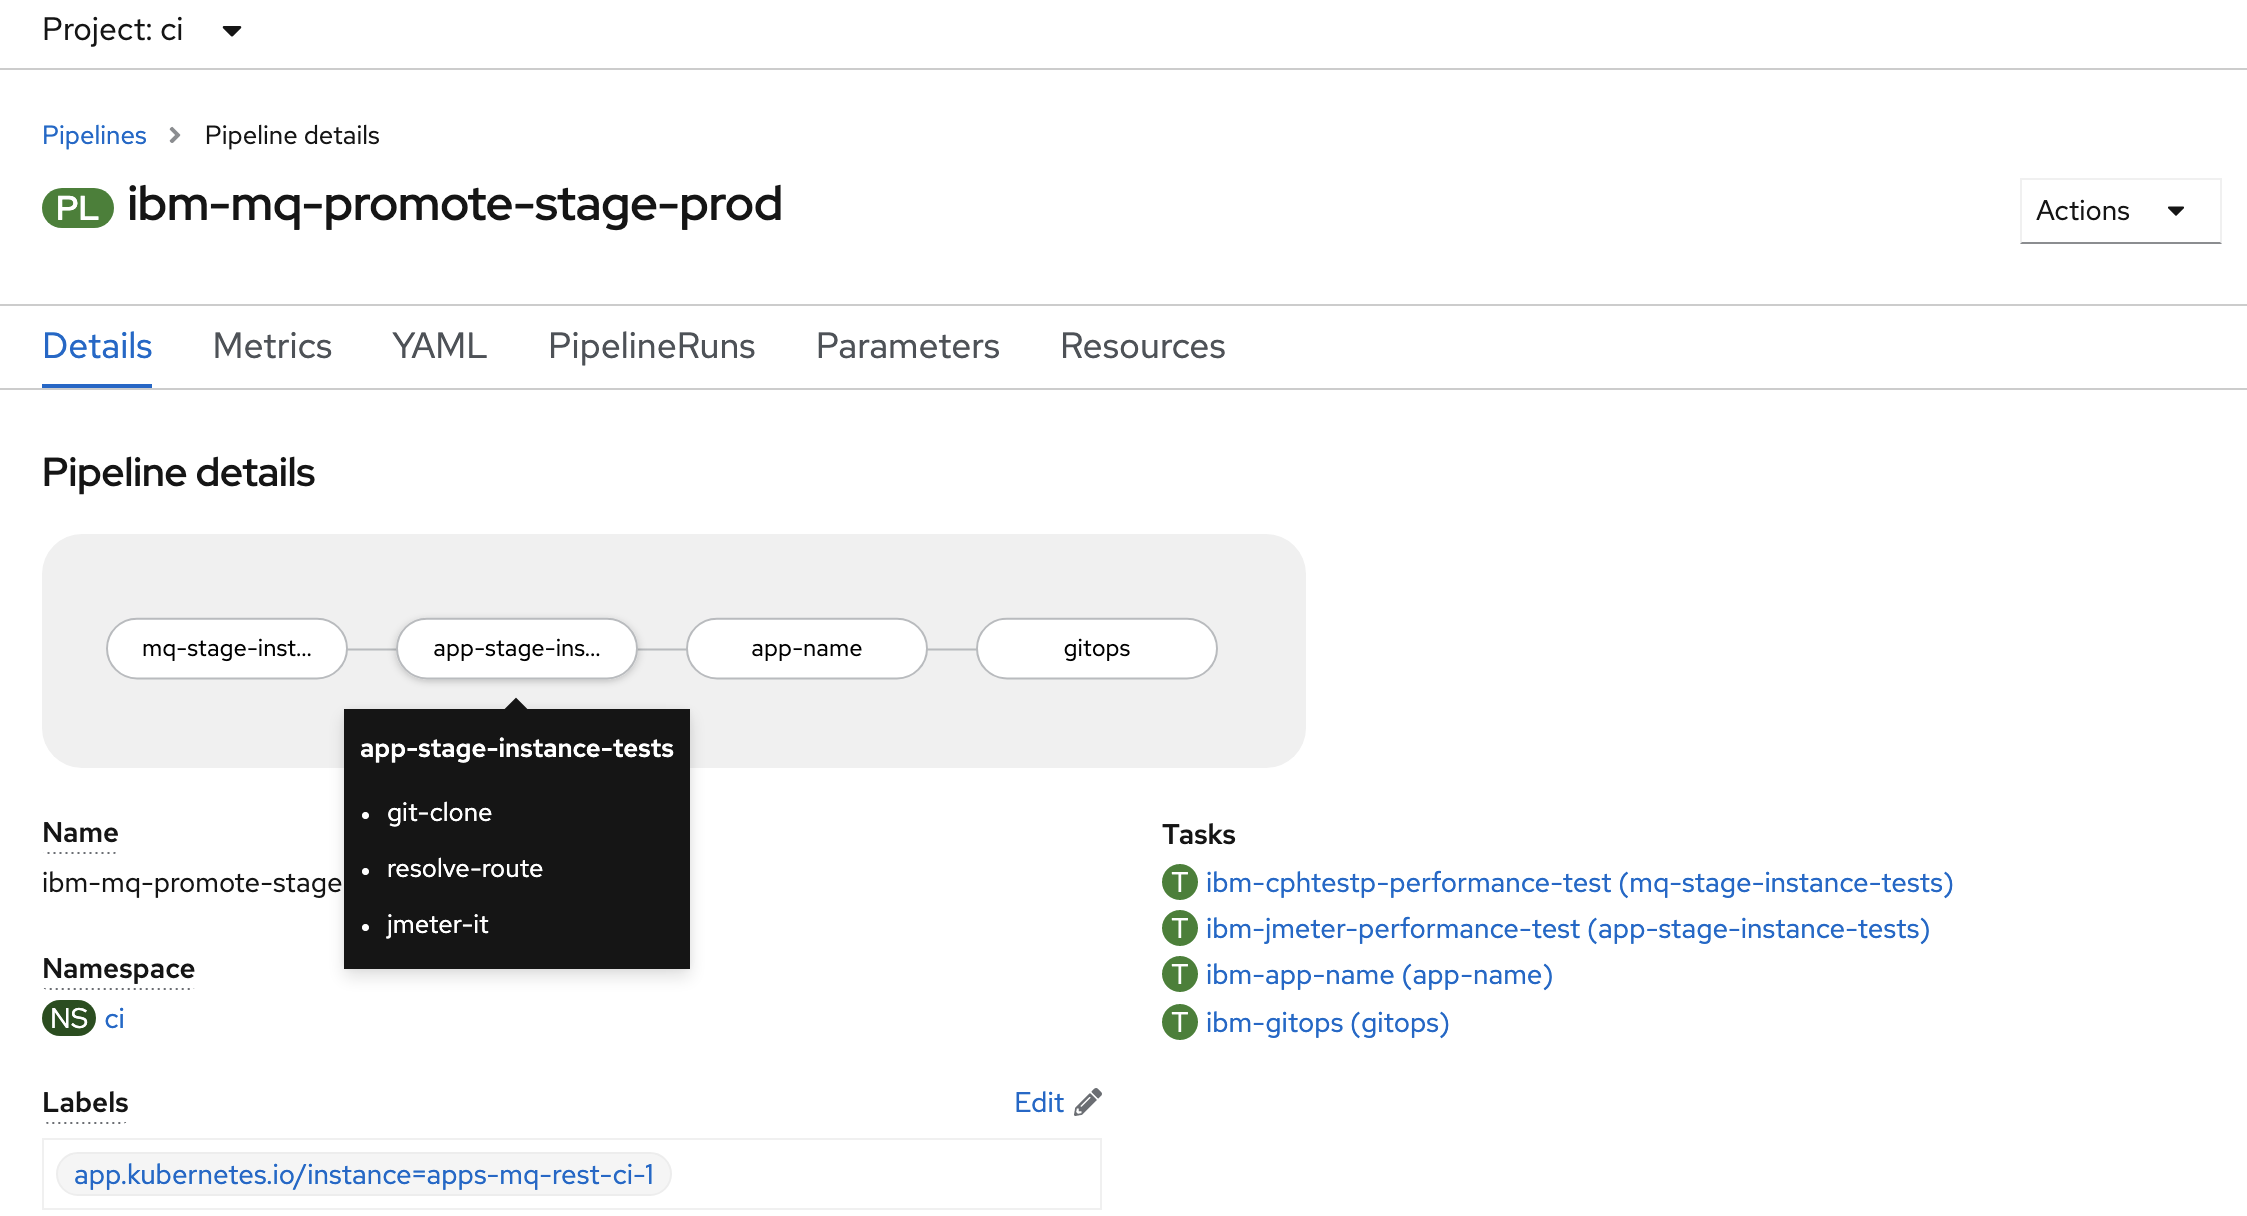
See how our pipeline is made up of tasks such as
mq-stage-instance-tests,app-stage-instance-tests,app-nameandgitops. These run in the order defined by the pipeline. Our pipeline is linear, though Tekton supports more sophisticated pipeline graphs if necessary.See how each task comprises a set of steps such as
git-cloneorsetup. These run in the order defined by the task. -
The pipeline run logs
When a pipeline runs, all its output is captured in a set of logs, one for each task.
Click on the
app-stage-instance-teststask to show its logs: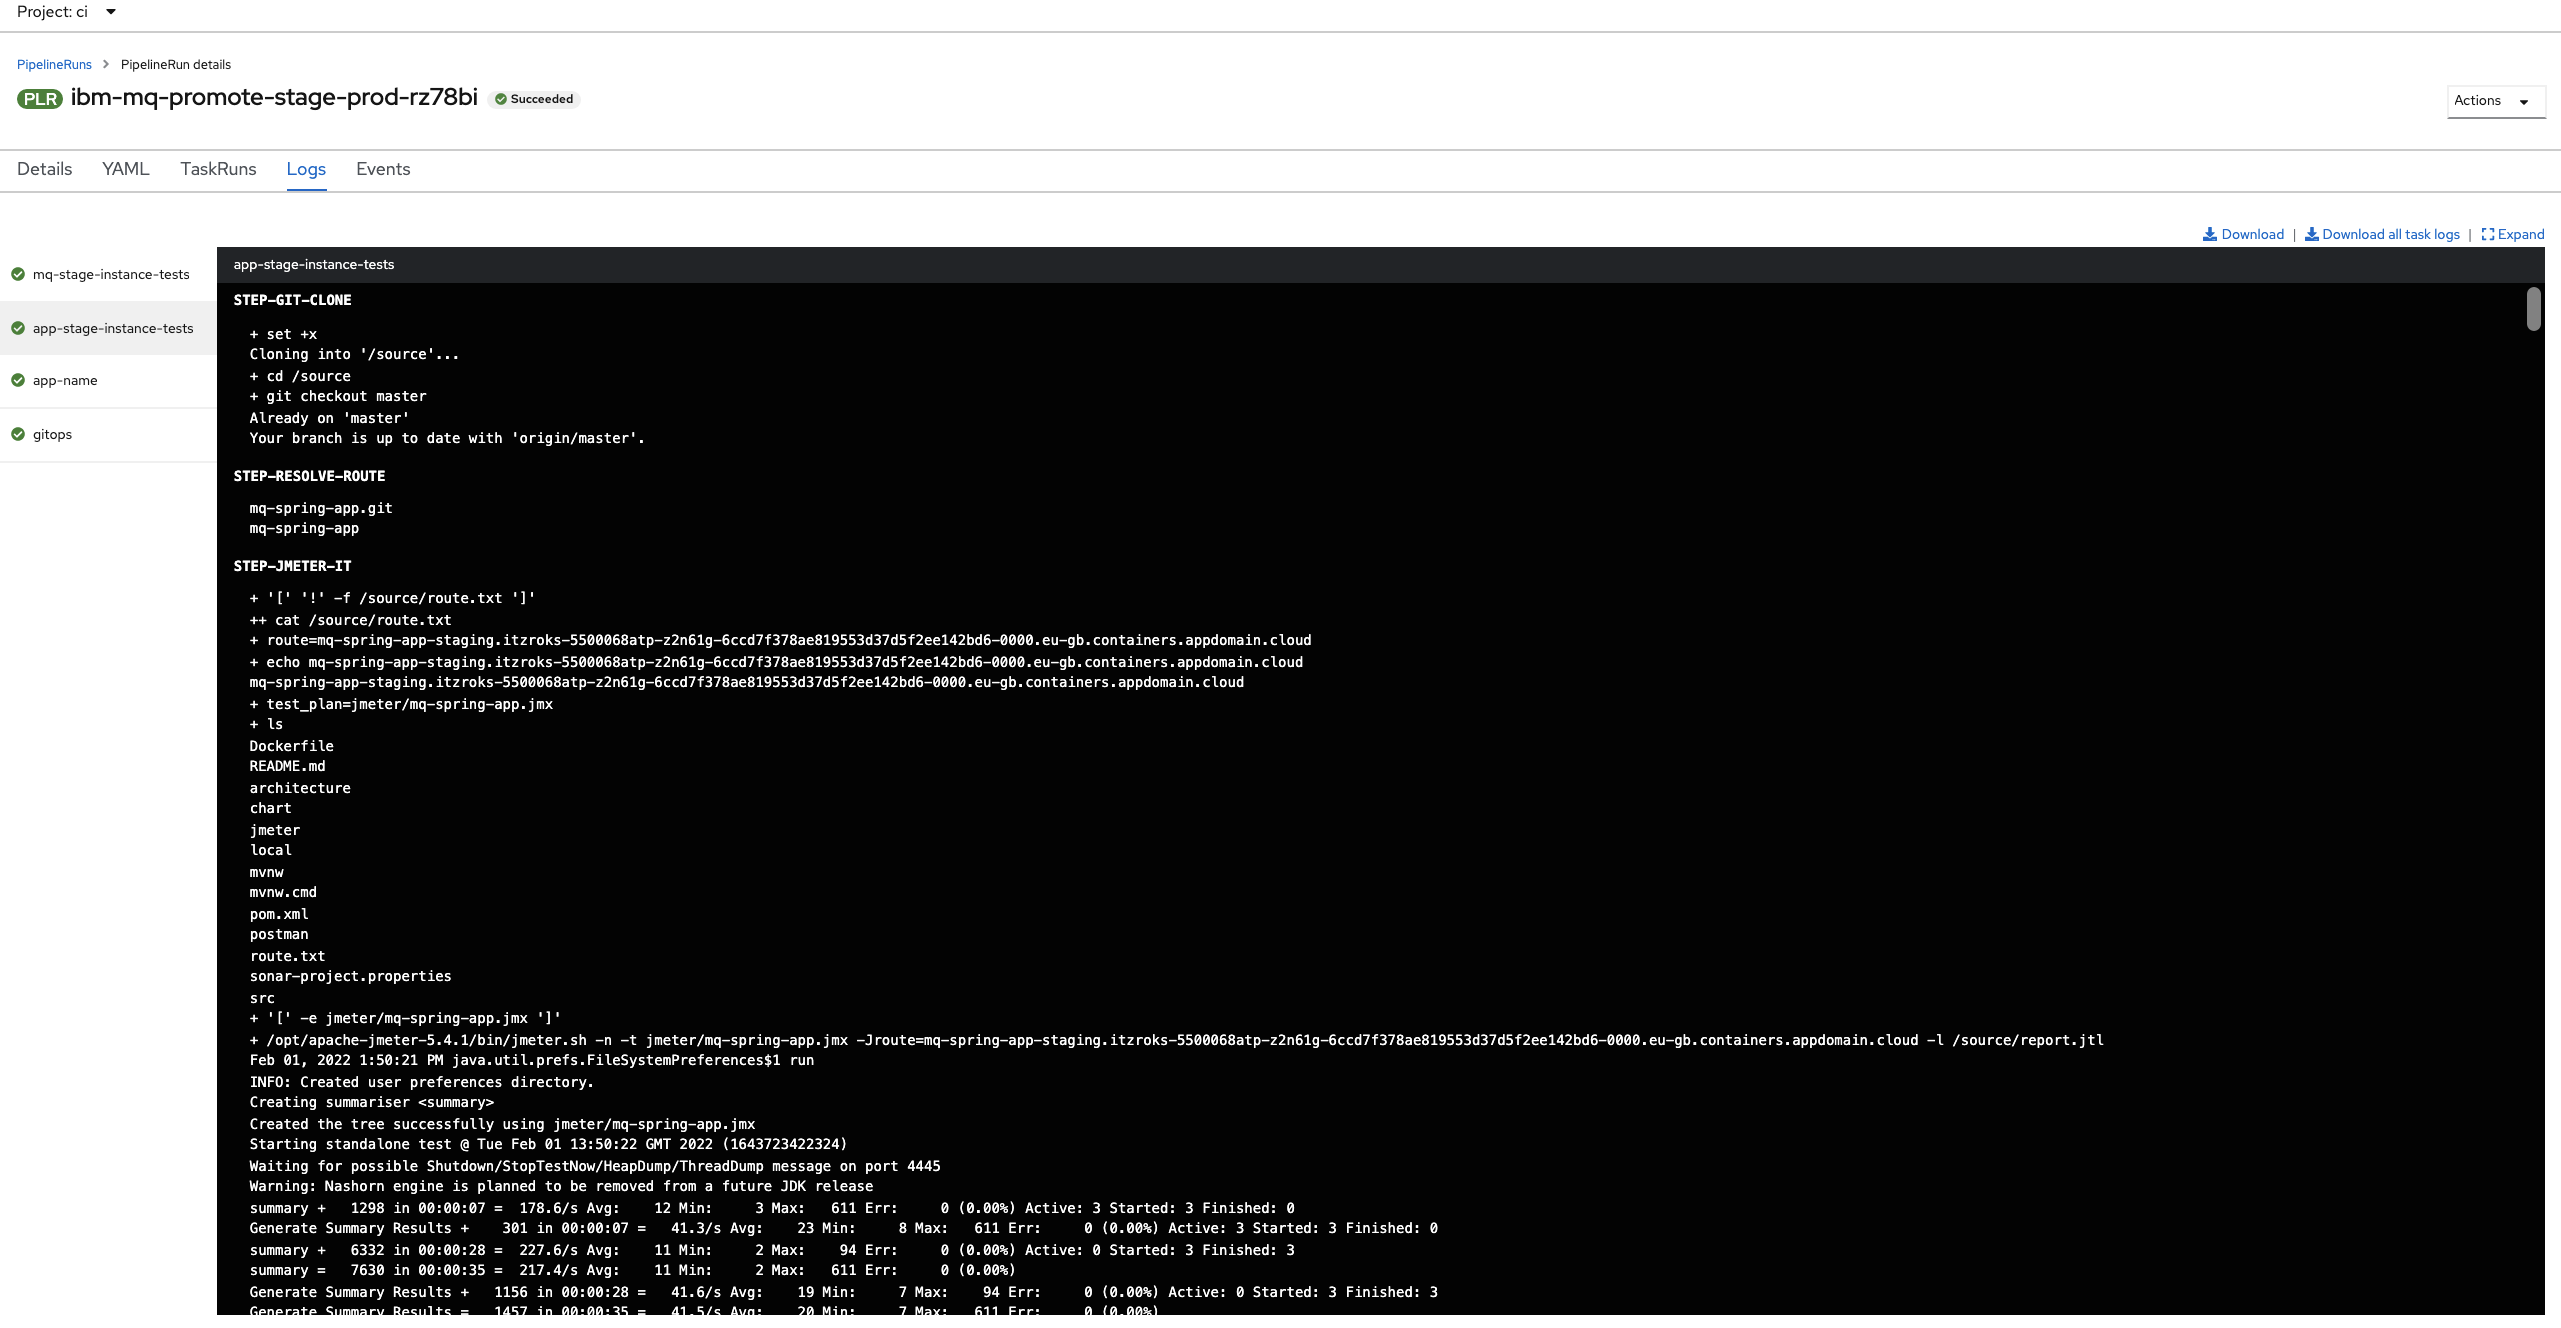
(Alternatively, you can select the
Logstab from the UI, and then select the tasks on the left pane within the pipeline run view.)See how the
app-stage-instance-teststask has its output in a dedicated log. You can select any log for any task that has completed or is executing. When a pipeline run completes, all its logs remain available, which can help diagnosing problems for example. -
Exploring an example task output:
app-stage-instance-testsIt's easy to examine a task log; you simply select the relevant task and scroll the log up or down. For active tasks the log will be dynamically updated.
Click on the
app-stage-instance-teststask: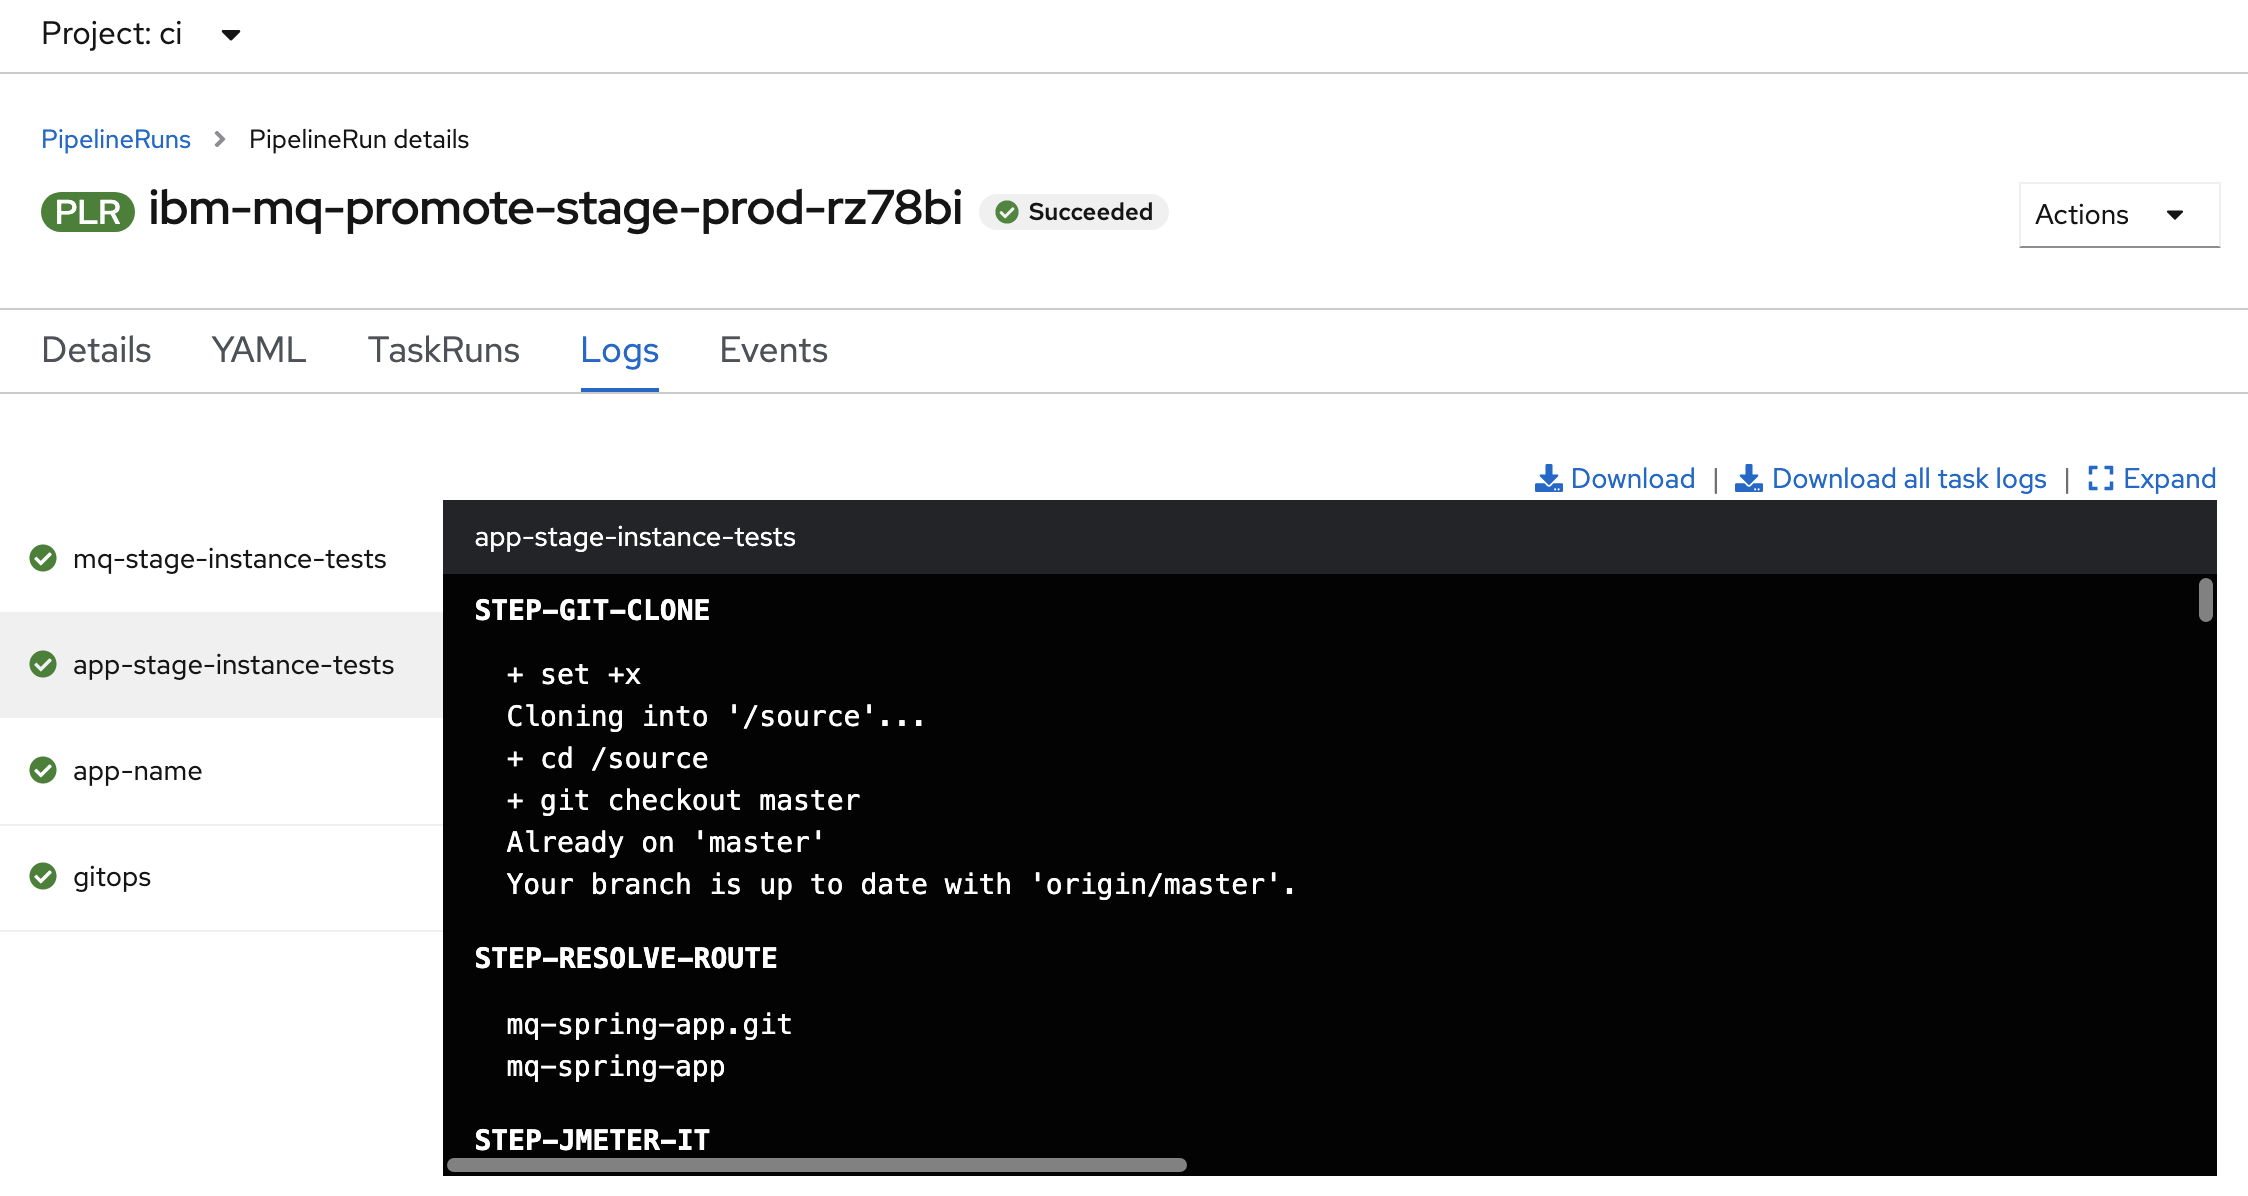
This console window shows the output generated by
app-stage-instance-teststask. As the task script proceeds, its output is captured; that's what we can see in this window.Notice that the
app-stage-instance-teststask output is from the first step in theapp-stage-instance-teststask. This step is calledSTEP-GIT-CLONE. Note how the step names are capitalized in the web console output.Let's look at another task and its steps more closely.
-
Exploring a task step in detail:
STEP-JMETER-ITA task is built of multiple steps. Let's explore the
app-stage-instance-teststask and itsstep-jmeter-itstep.Select the
stage-instance-teststask and scroll through its logs to see its third step,STEP-JMETER-IT: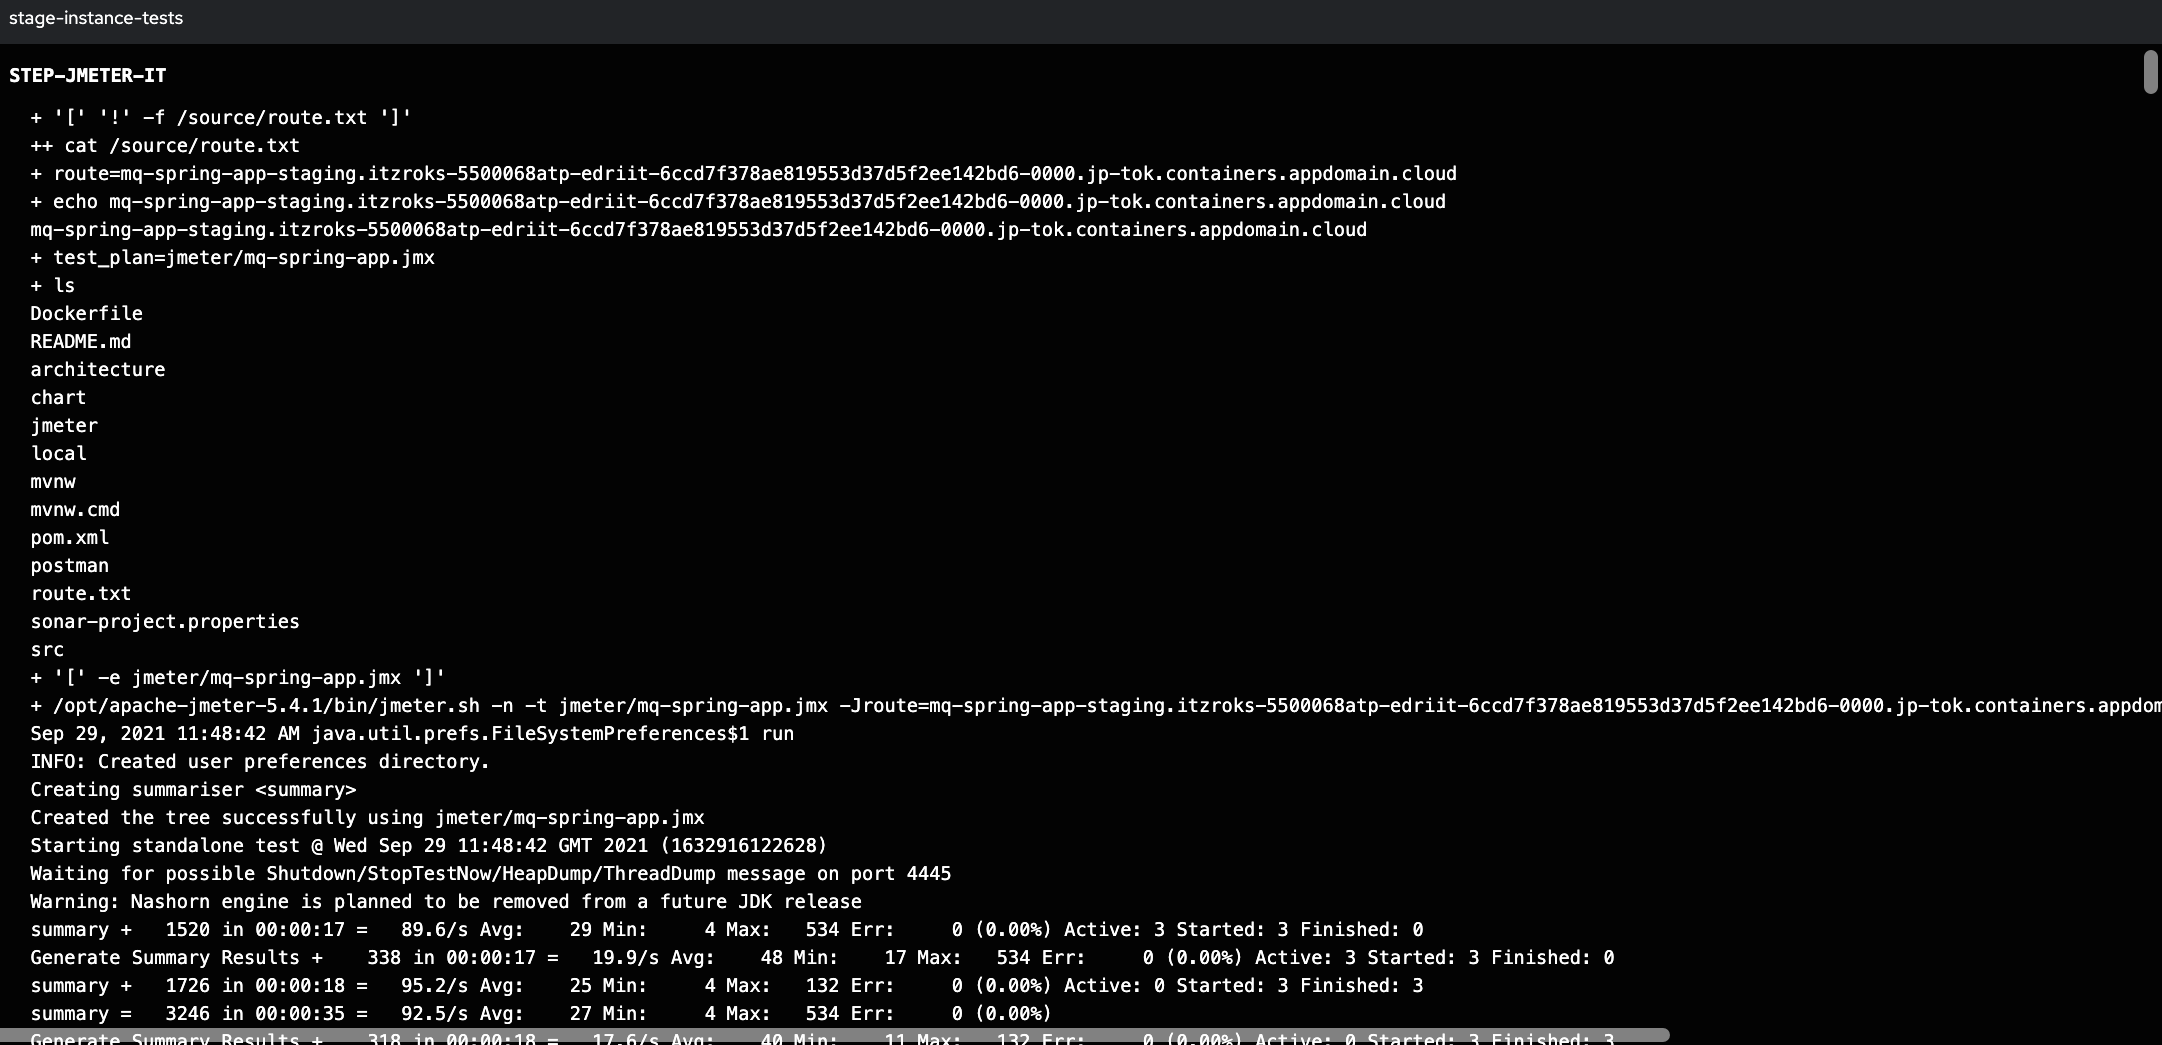
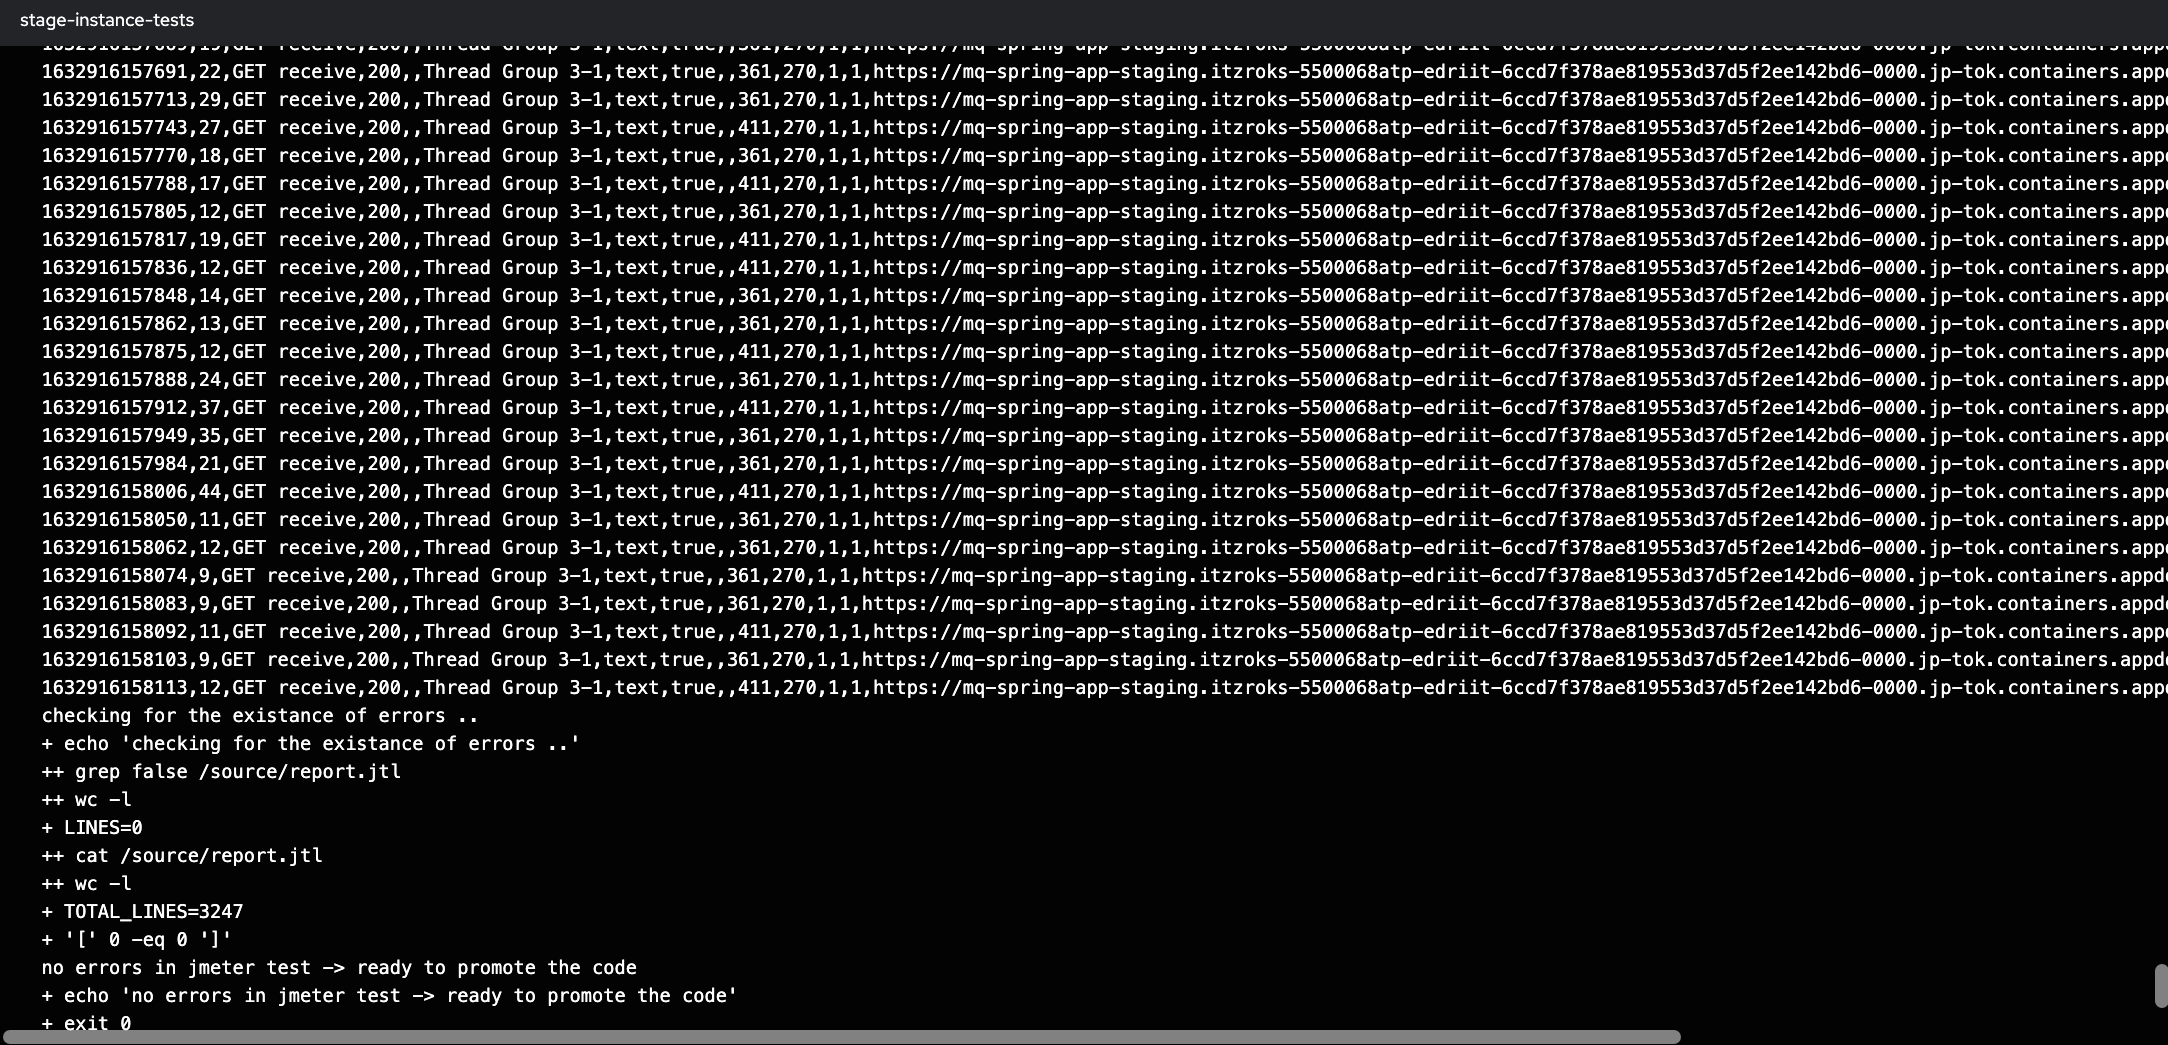
See how the
step-jmeter-itoutput is captured in the same log as the previous stepgit-clone.
Pipeline details
-
The pipeline definition
Up to this point, we've examined the pipeline run and the logs it generates. Let's now look at how a pipeline is defined.
Issue the following command to show the
ibm-mq-promote-stage-prodpipeline:oc describe pipeline ibm-mq-promote-stage-prod -n ciwhich shows the pipeline YAML in considerable detail:
Name:         ibm-mq-promote-stage-prod
Namespace:    ci
Labels:       app.kubernetes.io/instance=apps-mq-rest-ci-1
Annotations:  app.openshift.io/runtime: test
API Version:  tekton.dev/v1beta1
Kind:         Pipeline
Metadata:
  Creation Timestamp:  2022-02-01T08:57:44Z
  Generation:          1
  Managed Fields:
    API Version:  tekton.dev/v1beta1
    Fields Type:  FieldsV1
    fieldsV1:
      f:metadata:
        f:annotations:
          .:
          f:app.openshift.io/runtime:
          f:kubectl.kubernetes.io/last-applied-configuration:
        f:labels:
          .:
          f:app.kubernetes.io/instance:
      f:spec:
        .:
        f:params:
        f:tasks:
    Manager:         argocd-application-controller
    Operation:       Update
    Time:            2022-02-01T08:57:44Z
  Resource Version:  3333165
  UID:               2fca6c51-6782-44ff-8ac4-1e452dfaf5f5
Spec:
  Params:
    Description:  The url for the git repository
    Name:         git-url
    Type:         string
    Default:      master
    Description:  git branch for the test app
    Name:         git-revision
    Type:         string
    Default:      staging
    Description:  environment
    Name:         src-environment
    Type:         string
    Default:      prod
    Description:  environment
    Name:         dest-environment
    Type:         string
    Default:      mq/environments
    Description:  Path in gitops repo
    Name:         app-path
    Type:         string
    Default:      false
    Description:  Enable security for queueManager
    Name:         qm-security
    Type:         string
    Default:      true
    Description:  Enable the pipeline to do a PR for the gitops repo
    Name:         git-pr
    Type:         string
    Default:      jmeter/mq-spring-app.jmx
    Description:  Path of the postman collection
    Name:         test-plan
    Type:         string
  Tasks:
    Name:  mq-stage-instance-tests
    Params:
      Name:   git-url
      Value:  $(params.git-url)
      Name:   src-environment
      Value:  $(params.src-environment)
      Name:   qm-security
      Value:  $(params.qm-security)
      Name:   test-plan
      Value:  $(params.test-plan)
    Task Ref:
      Kind:  Task
      Name:  ibm-cphtestp-performance-test
    Name:    app-stage-instance-tests
    Params:
      Name:   git-url
      Value:  $(params.git-url)
      Name:   src-environment
      Value:  $(params.src-environment)
      Name:   test-plan
      Value:  $(params.test-plan)
    Run After:
      mq-stage-instance-tests
    Task Ref:
      Kind:  Task
      Name:  ibm-jmeter-performance-test
    Name:    app-name
    Params:
      Name:   git-url
      Value:  $(params.git-url)
    Run After:
      app-stage-instance-tests
    Task Ref:
      Kind:  Task
      Name:  ibm-app-name
    Name:    gitops
    Params:
      Name:   app-name
      Value:  $(tasks.app-name.results.app-name)
      Name:   src-environment
      Value:  $(params.src-environment)
      Name:   dest-environment
      Value:  $(params.dest-environment)
      Name:   app-path
      Value:  $(params.app-path)
      Name:   git-pr
      Value:  $(params.git-pr)
    Run After:
      app-name
    Task Ref:
      Kind:  Task
      Name:  ibm-gitops
Events:      <none>
Don't be intimidated by this output -- it's actually just a more detailed source view of the information shown for the
ibm-mq-promote-stage-prodpipeline in the web console.Locate the following key structures in the
PipelineYAML:API Version: tekton.dev/v1beta1andKind: Pipelineidentify this as a Tekton pipeline.Spec: Paramsidentifies the pipeline input parametersTasks:is a list of the tasks in this pipeline, each of which has- A
Name:naming the task - A set of
Params:identifying the task input parameters - An optional
Run After:value indicating when the task is run - A
Task Ref:identifying the actual task code to be run using the task's input
Notice that there's no code in the pipeline definition; instead, the definition specifies the required inputs to the pipeline, as well as the set of required tasks and their order of execution. The code executed by each task is identified by
Task Ref:, rather than in the pipeline; the pipeline definition merely defines the order of task execution and how parameters are marshaled between tasks.Let's now examine the pipeline definition in a little more detail.
-
The pipeline input
Spec: ParamsWhen we configure a pipeline run, the arguments map precisely to
Spec: Paramsin the pipeline YAML file.Below, we've just shown the
Spec: Params:for theibm-mq-promote-stage-prodpipeline:Spec: Params: Description: The url for the git repository Name: git-url Type: string Default: master Description: git branch for the test app Name: git-revision Type: string Default: staging Description: environment Name: src-environment Type: string Default: prod Description: environment Name: dest-environment Type: string Default: mq/environments Description: Path in gitops repo Name: app-path Type: string Default: false Description: Enable security for queueManager Name: qm-security Type: string Default: true Description: Enable the pipeline to do a PR for the gitops repo Name: git-pr Type: string Default: jmeter/mq-spring-app.jmx Description: Path of the postman collection Name: test-plan Type: stringSpend a few moments mapping each of these parameters maps to those on the
Start Pipelineinput dialog where you specified the pipeline run arguments. For example, mapName:,Description:andDefault:to the different fields in the dialog. -
Parameters for the first
setuptaskWe can see that the first task in the pipeline is called
mq-stage-instance-tests. Let's examine its YAML to see how it gets its input parameters:Tasks: Name: mq-stage-instance-tests Params: Name: git-url Value: $(params.git-url) Name: src-environment Value: $(params.src-environment) Name: qm-security Value: $(params.qm-security) Name: test-plan Value: $(params.test-plan) Task Ref: Kind: Task Name: ibm-cphtestp-performance-testSee how the
mq-stage-instance-teststask derives itsgit-urlparameter using the pipeline input parameter value$(params.git-url). See howsrc-environment,qm-security, andtest-planwork in a similar way. The first task in a pipeline typically works like this -- its parameters are mapped from the pipeline's input parameters.Notice also that some pipeline input parameters are not referred to by the
mq-stage-instance-teststask; they will be used by subsequent tasks using the appropriate$(params.)value. -
Passing arguments between tasks
As each task completes, the pipeline proceeds. When a new task starts it often requires one or more results generated by a previous task.
We can see a good example of this in the
gitopstask:Name: gitops Params: Name: app-name Value: $(tasks.app-name.results.app-name) Name: src-environment Value: $(params.src-environment) Name: dest-environment Value: $(params.dest-environment) Name: app-path Value: $(params.app-path) Name: git-pr Value: $(params.git-pr) Run After: app-name Task Ref: Kind: Task Name: ibm-gitopsSee how the
gitopstask specifies that theapp-nameparameter should use value generated by theapp-nametask using the syntax:$(tasks.app-name.results.app-name).Also notice how the
gitopstasks usesRun After:to specify that it should execute after theapp-nametask. This follows the Kubernetes idiom of resources being declarative -- the order of execution is defined byRunAfter:rather than the order in which tasks appear in the YAML.Again, notice that the
gitopstask doesn't contain the code that the task executes. This is contained inTask Ref:which identifiesibm-gitopsas the task to execute using the specified parameters. It's the code inibm-gitopswhich generates the log output for the task; we'll examine it later.The way pipelines tasks are designed makes them highly reusable. As we'll see later, tasks are written with defined inputs and outputs such that they can be re-used by different pipelines. Pipelines focus on organizing the order of task execution and how parameters are marshaled into and between tasks; it's the tasks that do the actual work.
-
Locating the pipeline and tasks source YAMLs
Finally, let's locate the source for the
ibm-mq-promote-stage-prodpipeline and the tasks within it.It is located in the following folder:
cd $GIT_ROOT
cd multi-tenancy-gitops-apps
tree mq/environments/ci/pipelines/
We can see the other pipelines for the
cinamespace in this folder:mq/environments/ci/pipelines/ ├── ibm-test-pipeline-for-dev.yaml ├── ibm-test-pipeline-for-stage.yaml ├── java-maven-dev-pipeline.yaml ├── mq-metric-samples-dev-pipeline.yaml ├── mq-pipeline-dev.yaml └── mq-spring-app-dev-pipeline.yamlThese map to the MQ-related pipelines we saw in the
Pipelines->Pipelinesview in the web console. -
Exploring the
ibm-mq-promote-stage-prodsource YAMLView the source for the
ibm-test-pipeline-for-stage.yamlpipeline with the command:cat mq/environments/ci/pipelines/ibm-test-pipeline-for-stage.yamlwhich shows the source YAML for the
ibm-mq-promote-stage-prodpipeline:apiVersion: tekton.dev/v1beta1 kind: Pipeline metadata: name: ibm-mq-promote-stage-prod annotations: app.openshift.io/runtime: test spec: params: - name: git-url description: The url for the git repository - name: git-revision description: git branch for the test app default: master - name: src-environment description: environment default: staging - name: dest-environment description: environment default: prod - name: app-path description: Path in gitops repo default: mq/environments - name: qm-security description: Enable security for queueManager default: "false" - name: git-pr description: Enable the pipeline to do a PR for the gitops repo default: "true" - name: test-plan description: Path of the postman collection default: "jmeter/mq-spring-app.jmx" tasks: - name: mq-stage-instance-tests taskRef: name: ibm-cphtestp-performance-test params: - name: git-url value: "$(params.git-url)" - name: src-environment value: "$(params.src-environment)" - name : qm-security value: "$(params.qm-security)" - name: test-plan value: "$(params.test-plan)" - name: app-stage-instance-tests taskRef: name: ibm-jmeter-performance-test runAfter: - mq-stage-instance-tests params: - name: git-url value: "$(params.git-url)" - name: src-environment value: "$(params.src-environment)" - name: test-plan value: "$(params.test-plan)" - name: app-name taskRef: name: ibm-app-name runAfter: - app-stage-instance-tests params: - name: git-url value: "$(params.git-url)" - name: gitops taskRef: name: ibm-gitops runAfter: - app-name params: - name: app-name value: "$(tasks.app-name.results.app-name)" - name: src-environment value: "$(params.src-environment)" - name: dest-environment value: "$(params.dest-environment)" - name: app-path value: "$(params.app-path)" - name: git-pr value: "$(params.git-pr)"This YAML is slightly different to the output of the
oc get pipelinecommand, because extra information is added during deployment such asCreation Timestamp:. -
Finding the ArgoCD application that manages pipelines
You can see how the
ibm-mq-promote-stage-prodand other pipeline YAMLs were deployed by examining the ArgoCD application that watches the folder containing thecinamespace pipelines.Issue the following command:
cat mq/config/argocd/ci/ci-app-rest.yamlwhich shows the
apps-mq-rest-ci-1ArgoCD application that watches for updates:apiVersion: argoproj.io/v1alpha1 kind: Application metadata: name: apps-mq-rest-ci-1 annotations: argocd.argoproj.io/sync-wave: "300" finalizers: - resources-finalizer.argocd.argoproj.io spec: destination: namespace: ci server: https://kubernetes.default.svc project: applications source: path: mq/environments/ci repoURL: https://github.com/prod-ref-guide/multi-tenancy-gitops-apps.git targetRevision: master syncPolicy: automated: prune: true selfHeal: trueSee how this
apps-mq-rest-ci-1watches:path: mq/environments/ci. As we know, this folder contains the YAML for theibm-mq-promote-stage-prodand other pipelines underpipelinesfolder. When this ArgoCD application was made active in the cluster, it installed all the pipelines along with other resources in this folder.
Review the resultant GitOps application folders
The result of our previously successful ibm-mq-promote-stage-prod pipeline runs was to leave a PR in a GitOps folder for Queue Manager and MQ Sample application. This PR creates the kubernetes resources in the prod folder if they do not exist. If the resources are already there, it updates the resources to match the latest deployment currently residing in the staging namespace.
-
Ensure you've set up the $GIT_ORG environment variable
This chapter also uses environment variables to save typing and reduce errors.
Let's set up an environment variable,
$GIT_ORG, that contains your GitHub organization name. We'll use this variable in many subsequent commands.Open a new terminal window.
Replace
<git-org>in the following command with your GitHub user name:export GIT_ORG=<git-org>You can verify your
$GIT_ORGas follows:echo $GIT_ORGwhich will show your GitHub Organization, for example:
prod-ref-guide -
Grab the
multi-tenancy-gitops-appsrepository urlIssue the below command to get the GitOps apps repository url.
echo https://github.com/$GIT_ORG/multi-tenancy-gitops-apps/pullswhich will give you an url, for instance:
https://github.com/prod-ref-guide/multi-tenancy-gitops-apps/pulls -
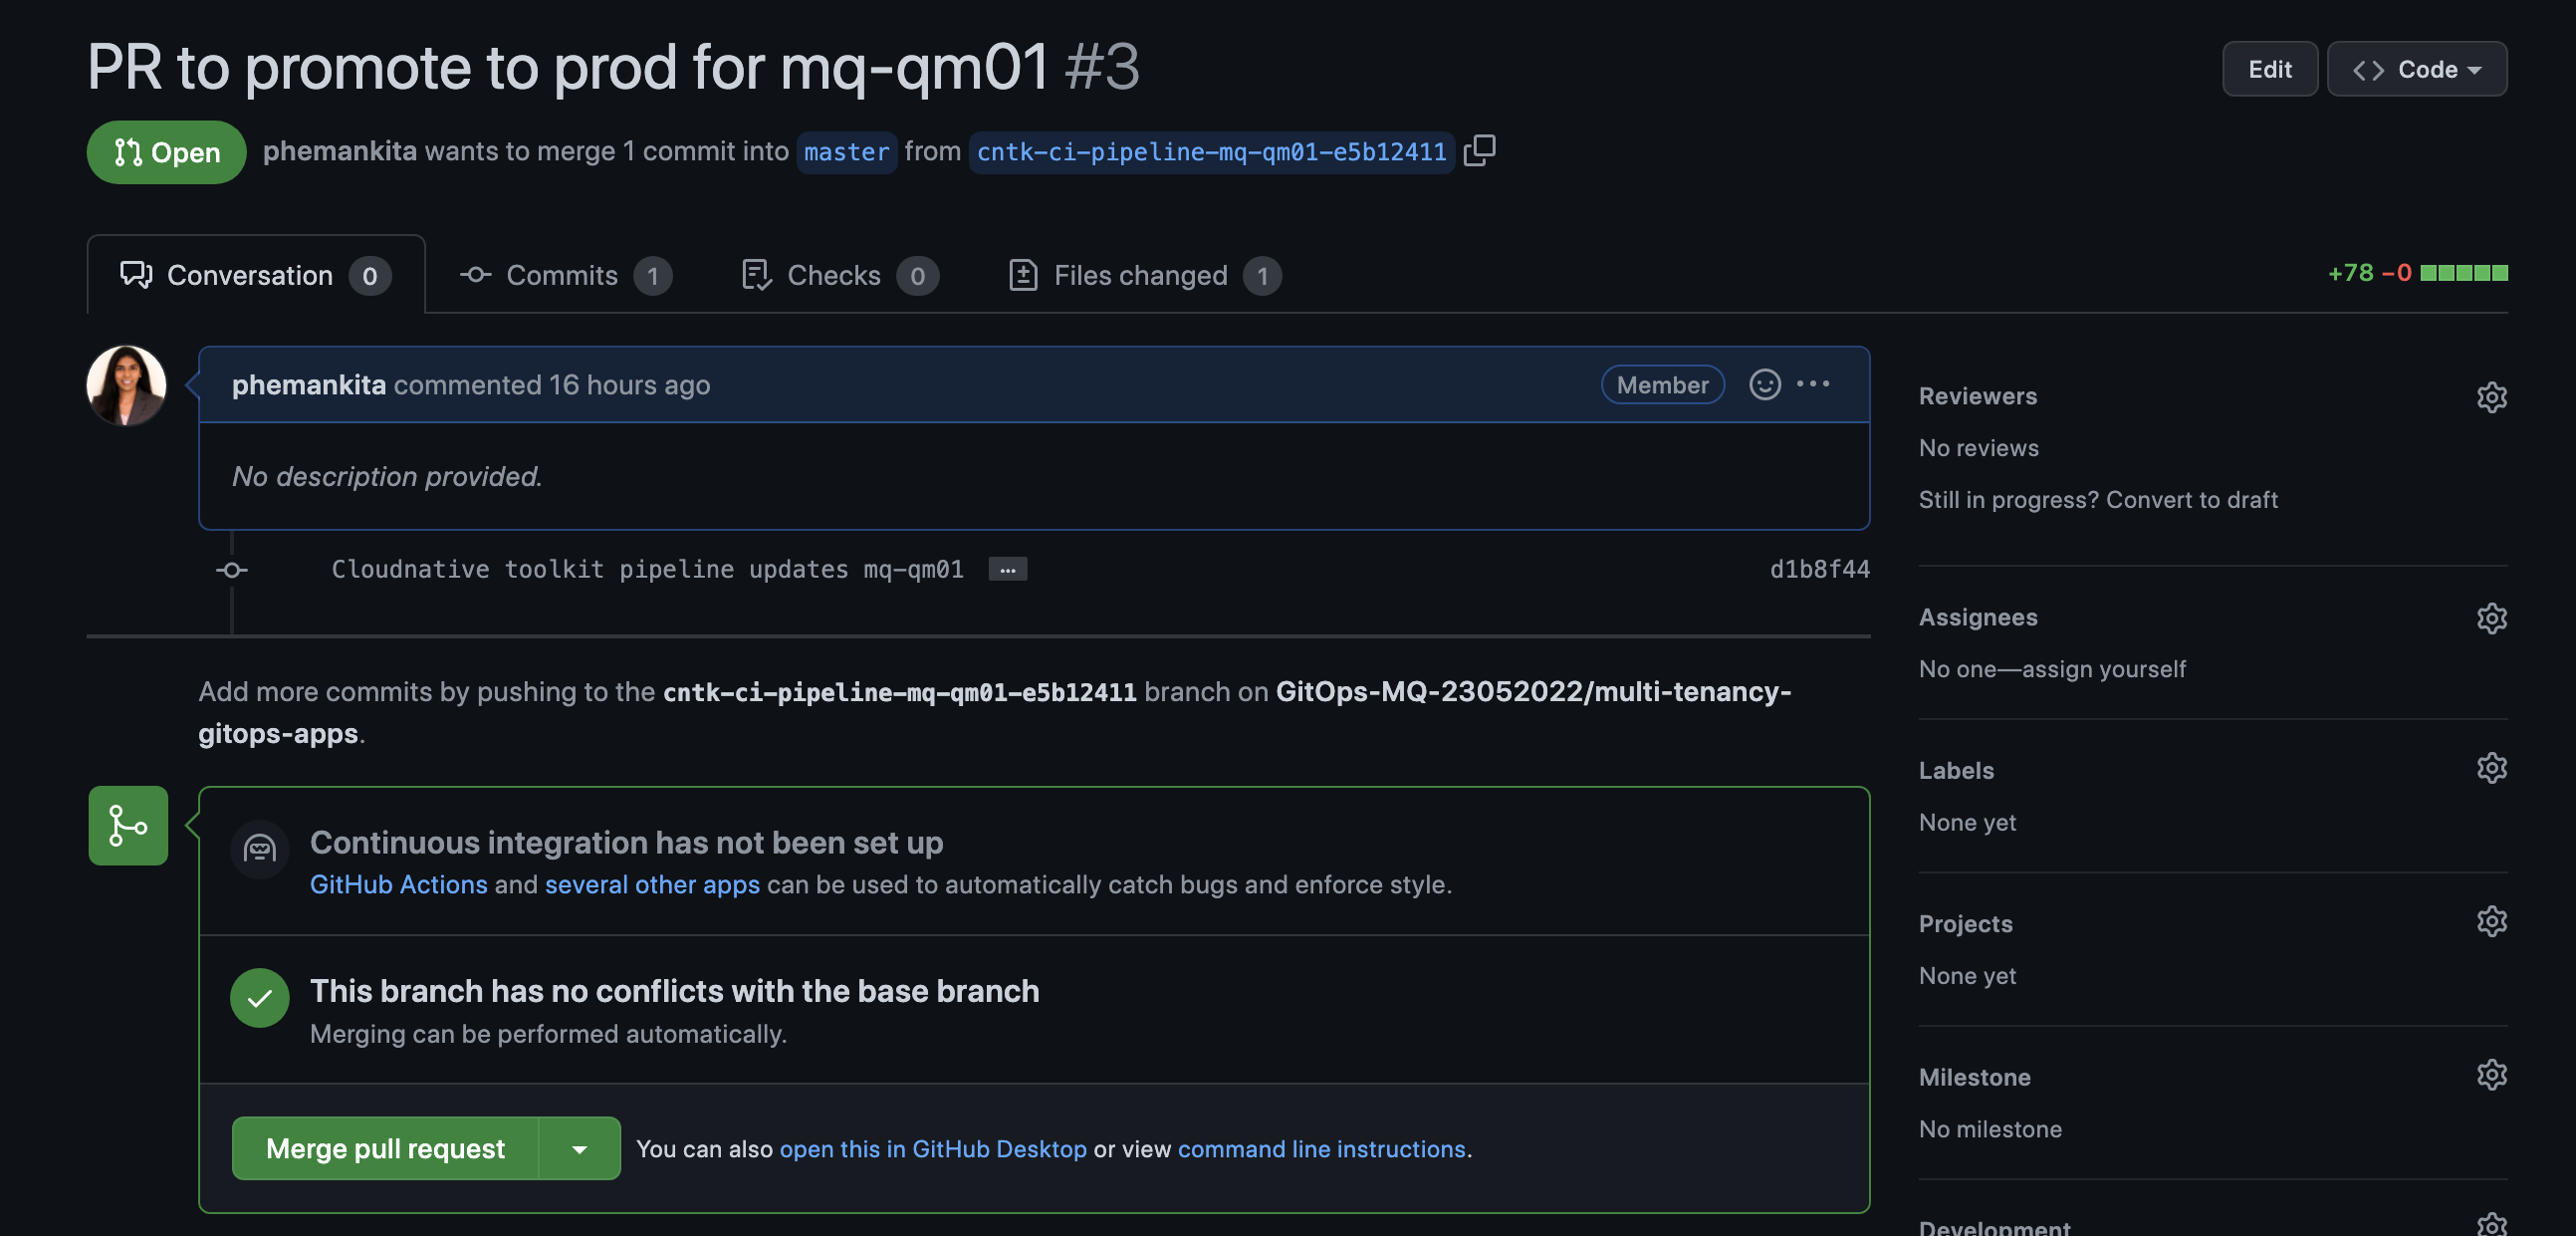
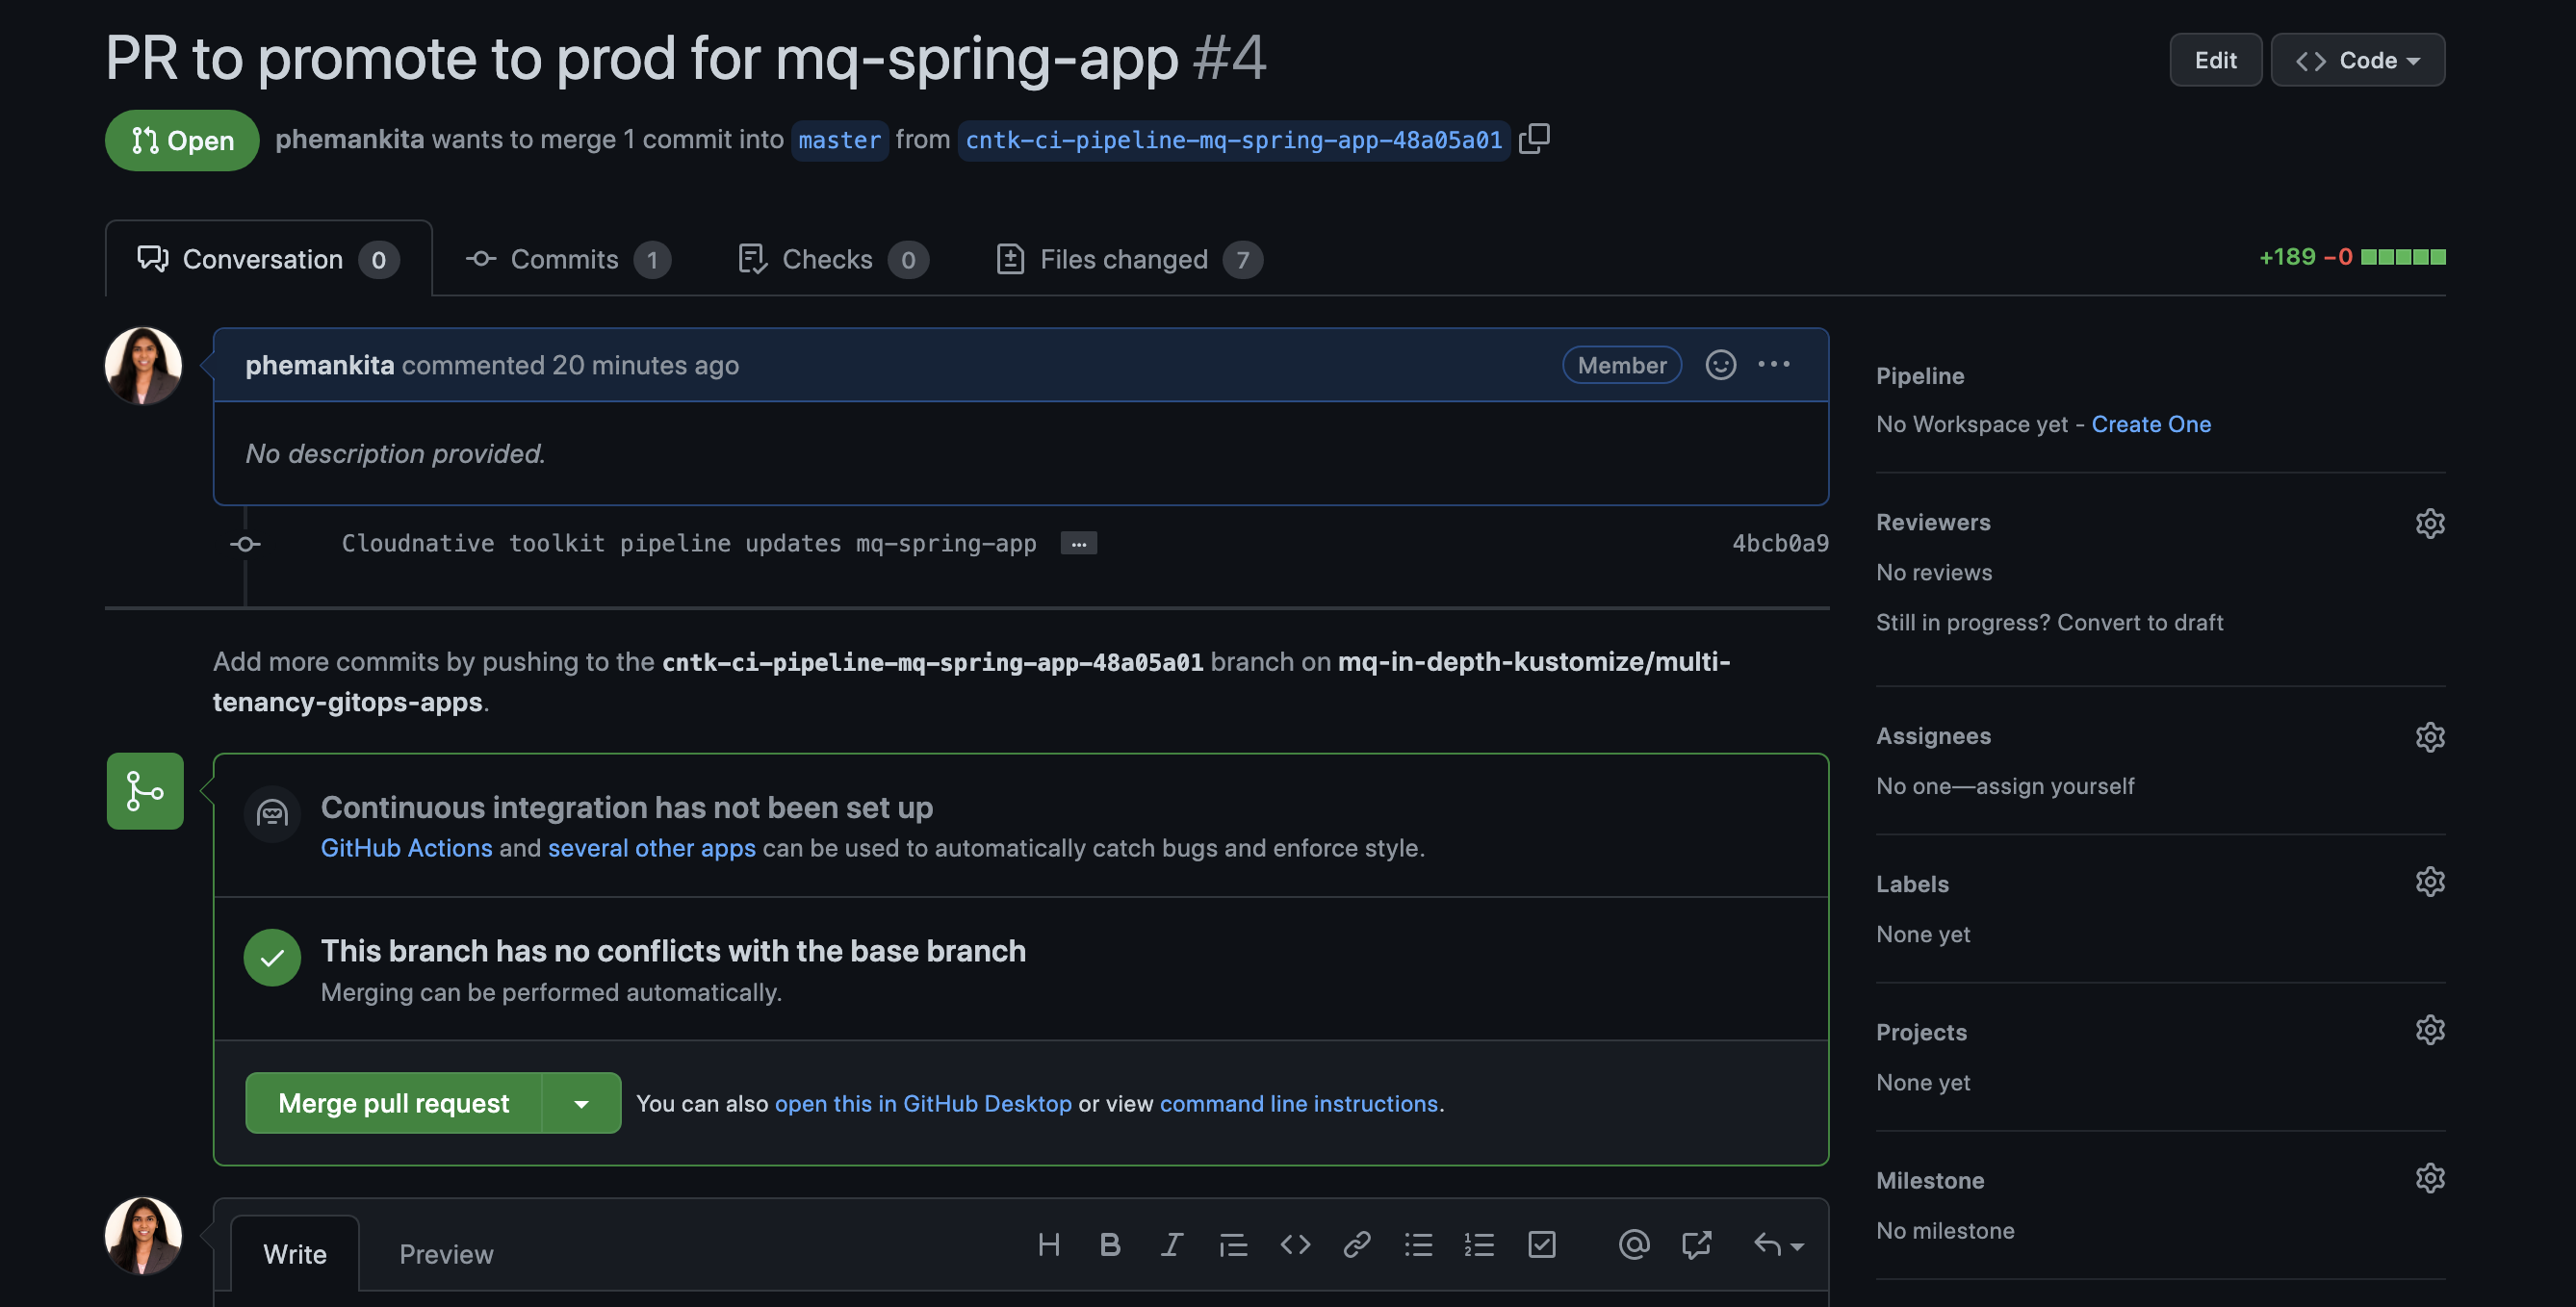
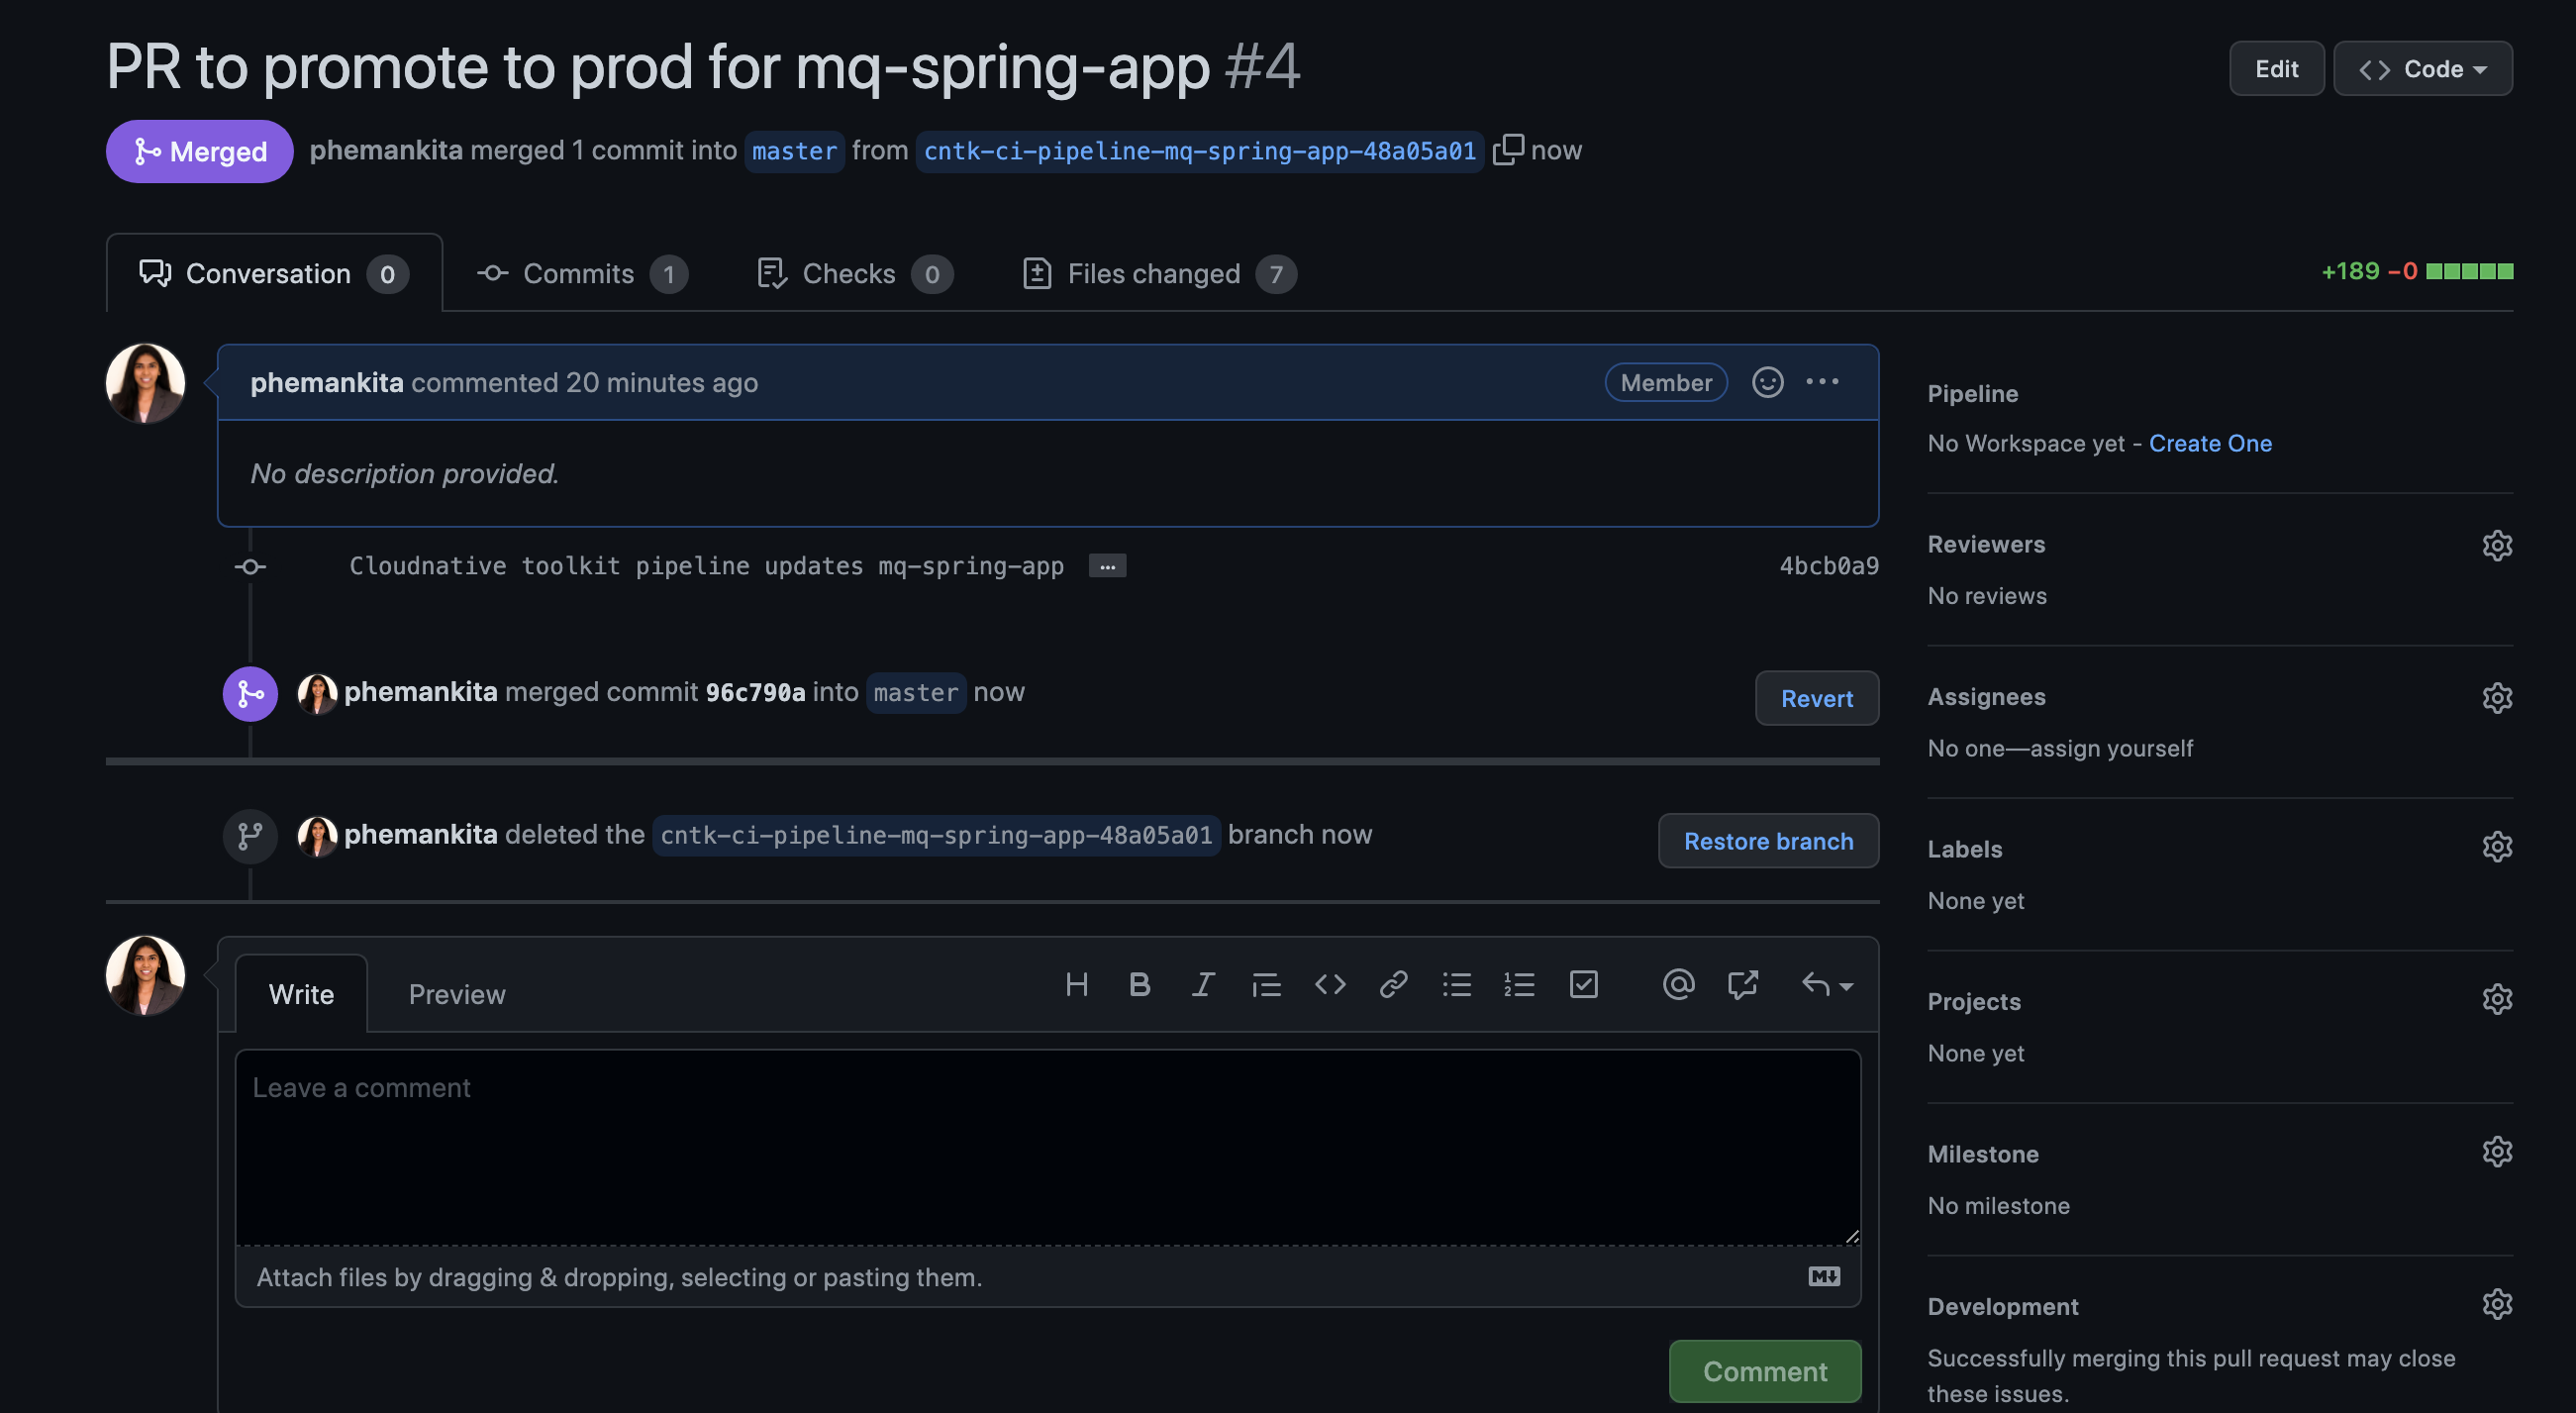
Review the Pull Requests created by
ibm-mq-promote-dev-stagepipelineOpen the above url in your browser and you will see Pull Requests generated by the
ibm-mq-promote-dev-stagepipeline.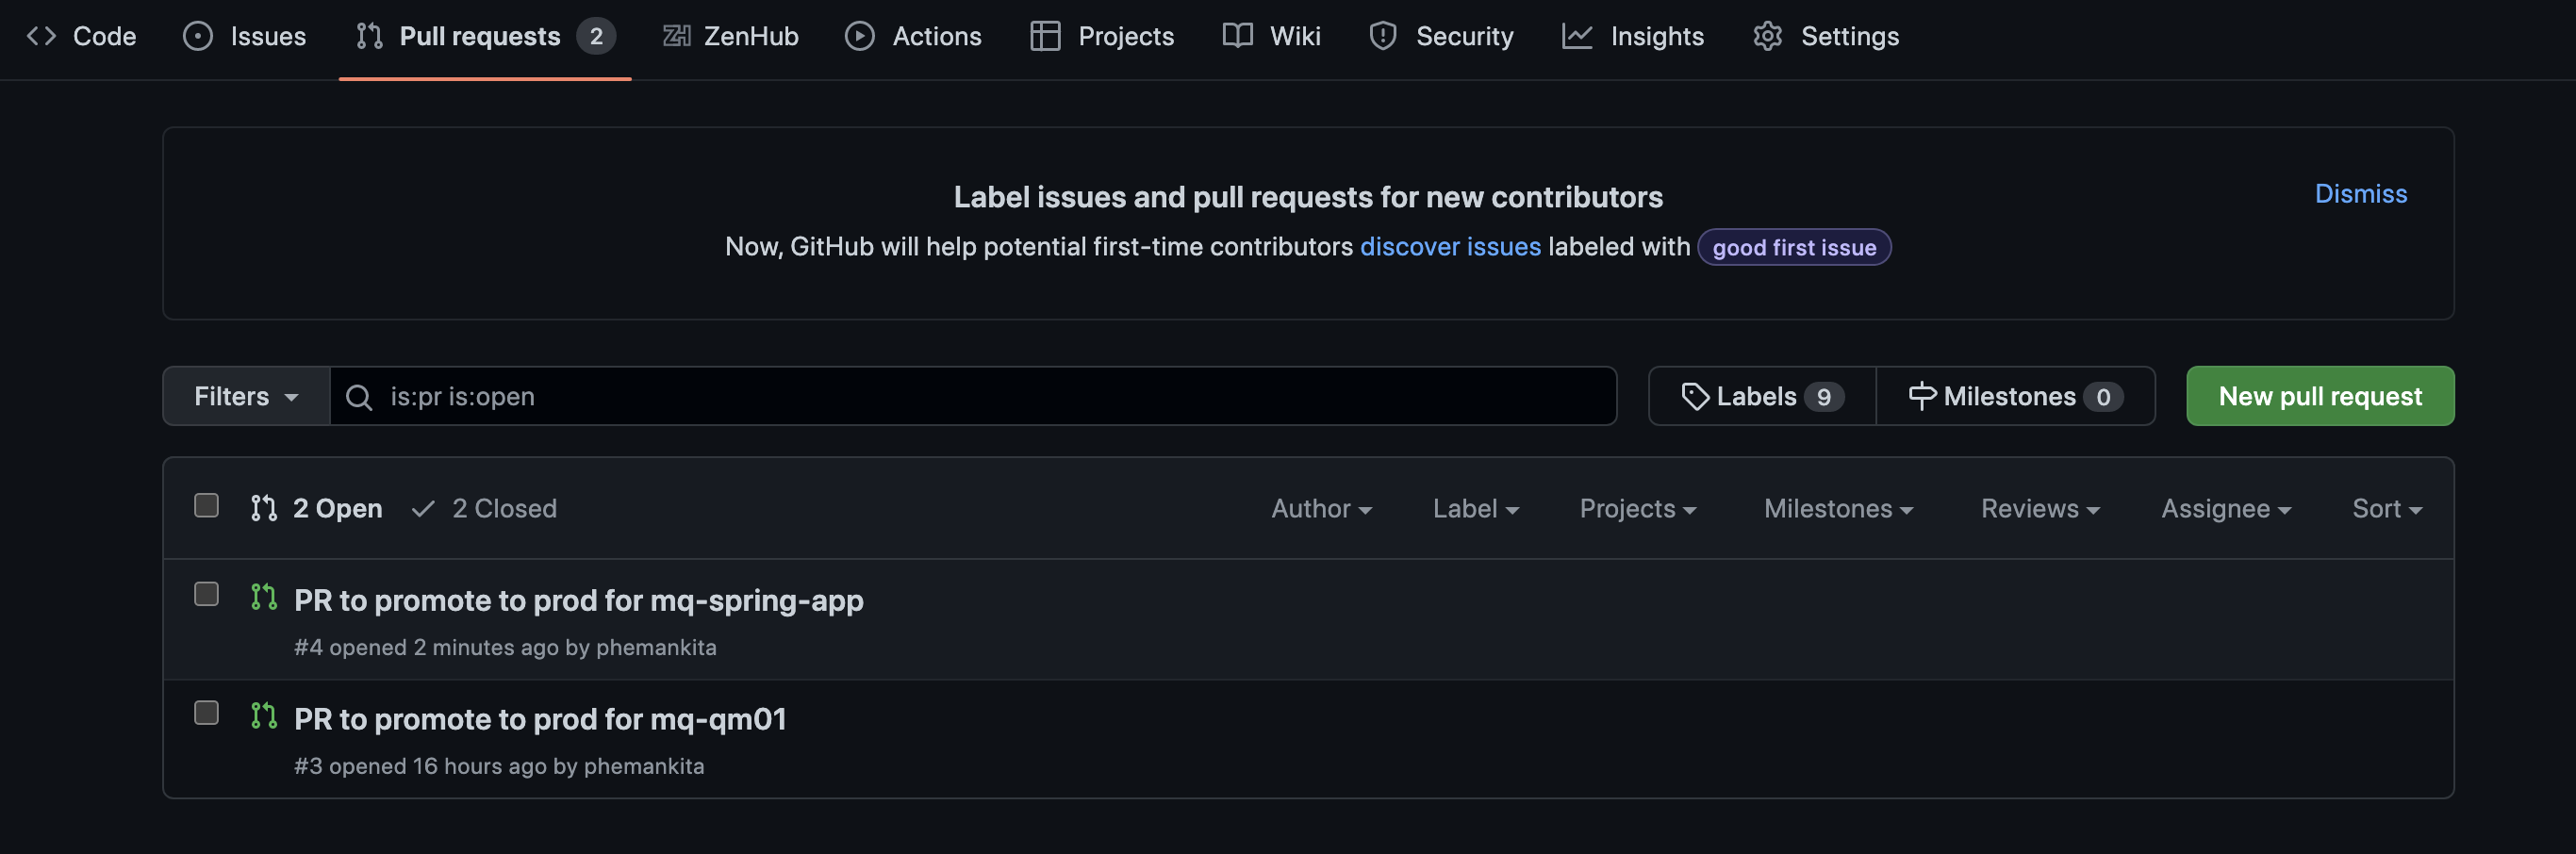
Merge these Pull Requests.
-
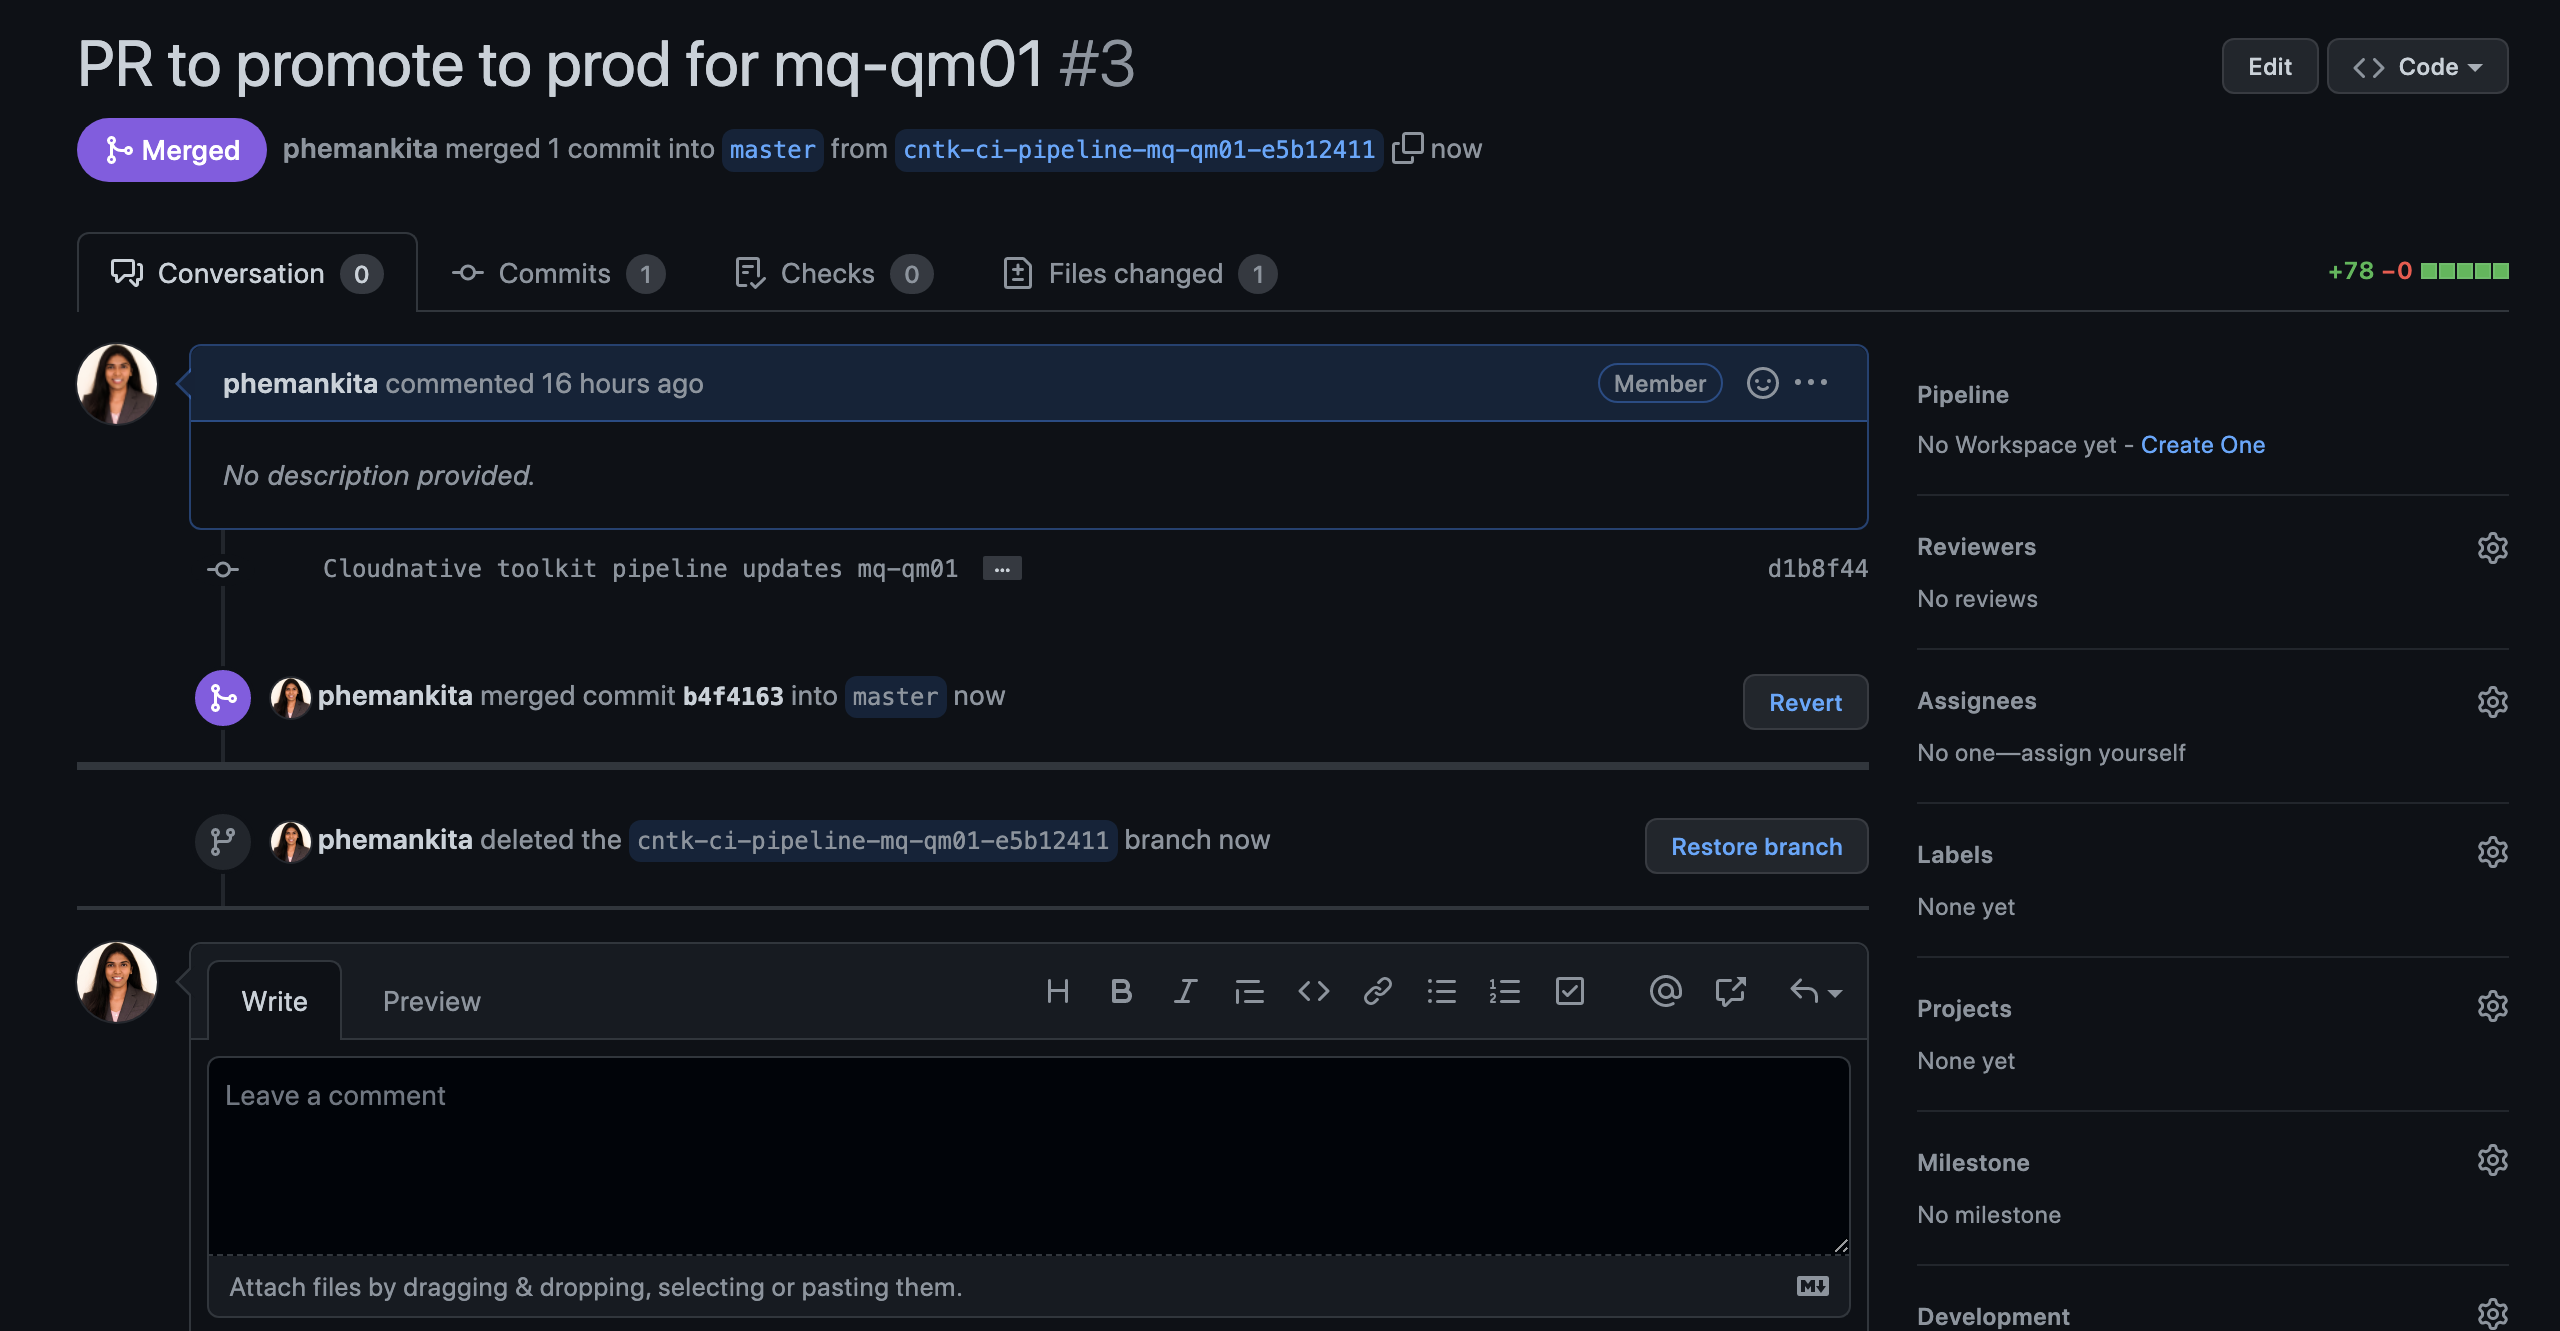
Re-merging local clone to view prod resources in GitOps apps repository
The
ibm-mq-promote-stage-prodpipeline left a Pull request and we merged the changes in the previous step. This means that our local clone of the GitOps repository is one commit behind GitHub. To allow us to view the changes locally, we must re-merge our local branch with GitHub.Return to the terminal window you're using for the
multi-tenancy-gitops-appsGitOps apps repository.Issue the following command to change to your GitOps apps repository:
cd $GIT_ROOT
cd multi-tenancy-gitops-apps
Issue the following commands to merge the local branch:
git fetch origin
git merge origin/$GIT_BRANCH
which shows our local branch being updated:
Updating e5b1241..2a215af
Fast-forward
 mq/environments/prod/mq-qm01/queuemanager/queuemanager.yaml   |  78 +++++++++++++++++++++++++++++++++++++++++++++++
 mq/environments/prod/mq-spring-app/deployment/deployment.yaml | 100 ++++++++++++++++++++++++++++++++++++++++++++++++++++++++++++
 2 files changed, 178 insertions(+)
 create mode 100644 mq/environments/prod/mq-qm01/queuemanager/queuemanager.yaml
 create mode 100644 mq/environments/prod/mq-spring-app/deployment/deployment.yaml
Notice how these files correspond to the new kubernetes resources created in the GitOps apps repository by the
ibm-mq-promote-stage-prodpipeline run. -
Explore the resources in the GitOps Apps repository
Let's examine the newly produced resources in the GitOps apps repository; it was created by the previous pipeline runs.
Issue the following command:
tree mq/environments/prod/mq-qm01/queuemanager/which shows the newly produced Helm chart:
mq/environments/prod/mq-qm01/queuemanager/
└── queuemanager.yaml
Notice that:
- The template for
Queue Managerwas created in themq/environments/prod/mq-qm01/queuemanager/folder to reflect the fact this queue manager is part of the applications layer. - The resource was created in the
prodsubfolder to reflect the fact that it's going to be deployed to theprodnamespace. - The resource was created in a new folder
/mq-qm01. This folder is dedicated toQueue Manager.
Issue the following command:
tree mq/environments/prod/mq-spring-app/deployment/which shows the newly produced Helm chart:
mq/environments/prod/mq-spring-app/deployment/
└── deployment.yaml
Notice that:
- The resources for
MQ Sample applicationwas created in themq/environments/prod/mq-spring-app/deployment/folder to reflect the fact this application is part of the applications layer. - The resources were created in the
prodsubfolder to reflect the fact that it's going to be deployed to theprodnamespace. - The resources were created in a new folder
/mq-spring-app. This folder is dedicated toMQ Sample application.
- The template for
Activate ArgoCD Applications
We're now going to activate the ArgoCD applications to manage the deployment of Queue Manager and MQ Sample application to the prod namespace.
-
Ensure you're logged in to the cluster
Start a terminal window and log into your OCP cluster, substituting the
--tokenand--serverparameters with your values:oc login --token=<token> --server=<server>If you are unsure of these values, click your user ID in the OpenShift web console and select "Copy Login Command".
-
Locate your GitOps repository
If necessary, change to the root of your GitOps repository, which is stored in the
$GIT_ROOTenvironment variable.Issue the following command to change to your GitOps repository:
cd $GIT_ROOT cd multi-tenancy-gitops -
Select resources to deploy
Access the
0-bootstrap/single-cluster/3-apps/kustomization.yaml:cat 0-bootstrap/single-cluster/3-apps/kustomization.yamlOpen
0-bootstrap/single-cluster/3-apps/kustomization.yamland uncomment the below:- argocd/mq/prod.yamlOnce modified, it should be something like below:
resources: #- argocd/ace/cicd.yaml #- argocd/ace/dev.yaml #- argocd/ace/stage.yaml #- argocd/ace/prod.yaml - argocd/mq/cicd.yaml - argocd/mq/dev.yaml - argocd/mq/stage.yaml - argocd/mq/prod.yaml #- argocd/apic/cicd.yaml #- argocd/apic/dev.yaml #- argocd/apic/stage.yaml #- argocd/apic/prod.yaml #- argocd/bookinfo/cicd.yaml #- argocd/bookinfo/dev.yaml #- argocd/bookinfo/stage.yaml #- argocd/bookinfo/prod.yaml #- argocd/soapserver/soapserver.yaml patches: - target: group: argoproj.io kind: Application labelSelector: "gitops.tier.layer=applications" patch: |- - op: add path: /spec/source/repoURL value: https://github.com/prod-ref-guide/multi-tenancy-gitops-apps.git - op: add path: /spec/source/targetRevision value: master -
Push GitOps changes to GitHub
Let’s make these GitOps changes visible to the ArgoCD
applicationsapplication via GitHub.Add all changes in the current folder to a git index, commit them, and push them to GitHub:
git add .
git commit -s -m "Activating prod instance for queue manager and sample app"
git push origin $GIT_BRANCH
The changes have now been pushed to your GitOps repository:
Enumerating objects: 11, done.
Counting objects: 100% (11/11), done.
Delta compression using up to 8 threads
Compressing objects: 100% (6/6), done.
Writing objects: 100% (6/6), 515 bytes | 257.00 KiB/s, done.
Total 6 (delta 5), reused 0 (delta 0)
remote: Resolving deltas: 100% (5/5), completed with 5 local objects.
To https://github.com/hp-gitops-mq/multi-tenancy-gitops.git
   3225847..25f7459  master -> master
This change to the GitOps repository can now be used by ArgoCD.
-
The
applicationsargocd applicationLet's examine the ArgoCD application that manage the applications in our reference architecture.
In the ArgoCD UI Applications view, click on the icon for the
applicationsapplication: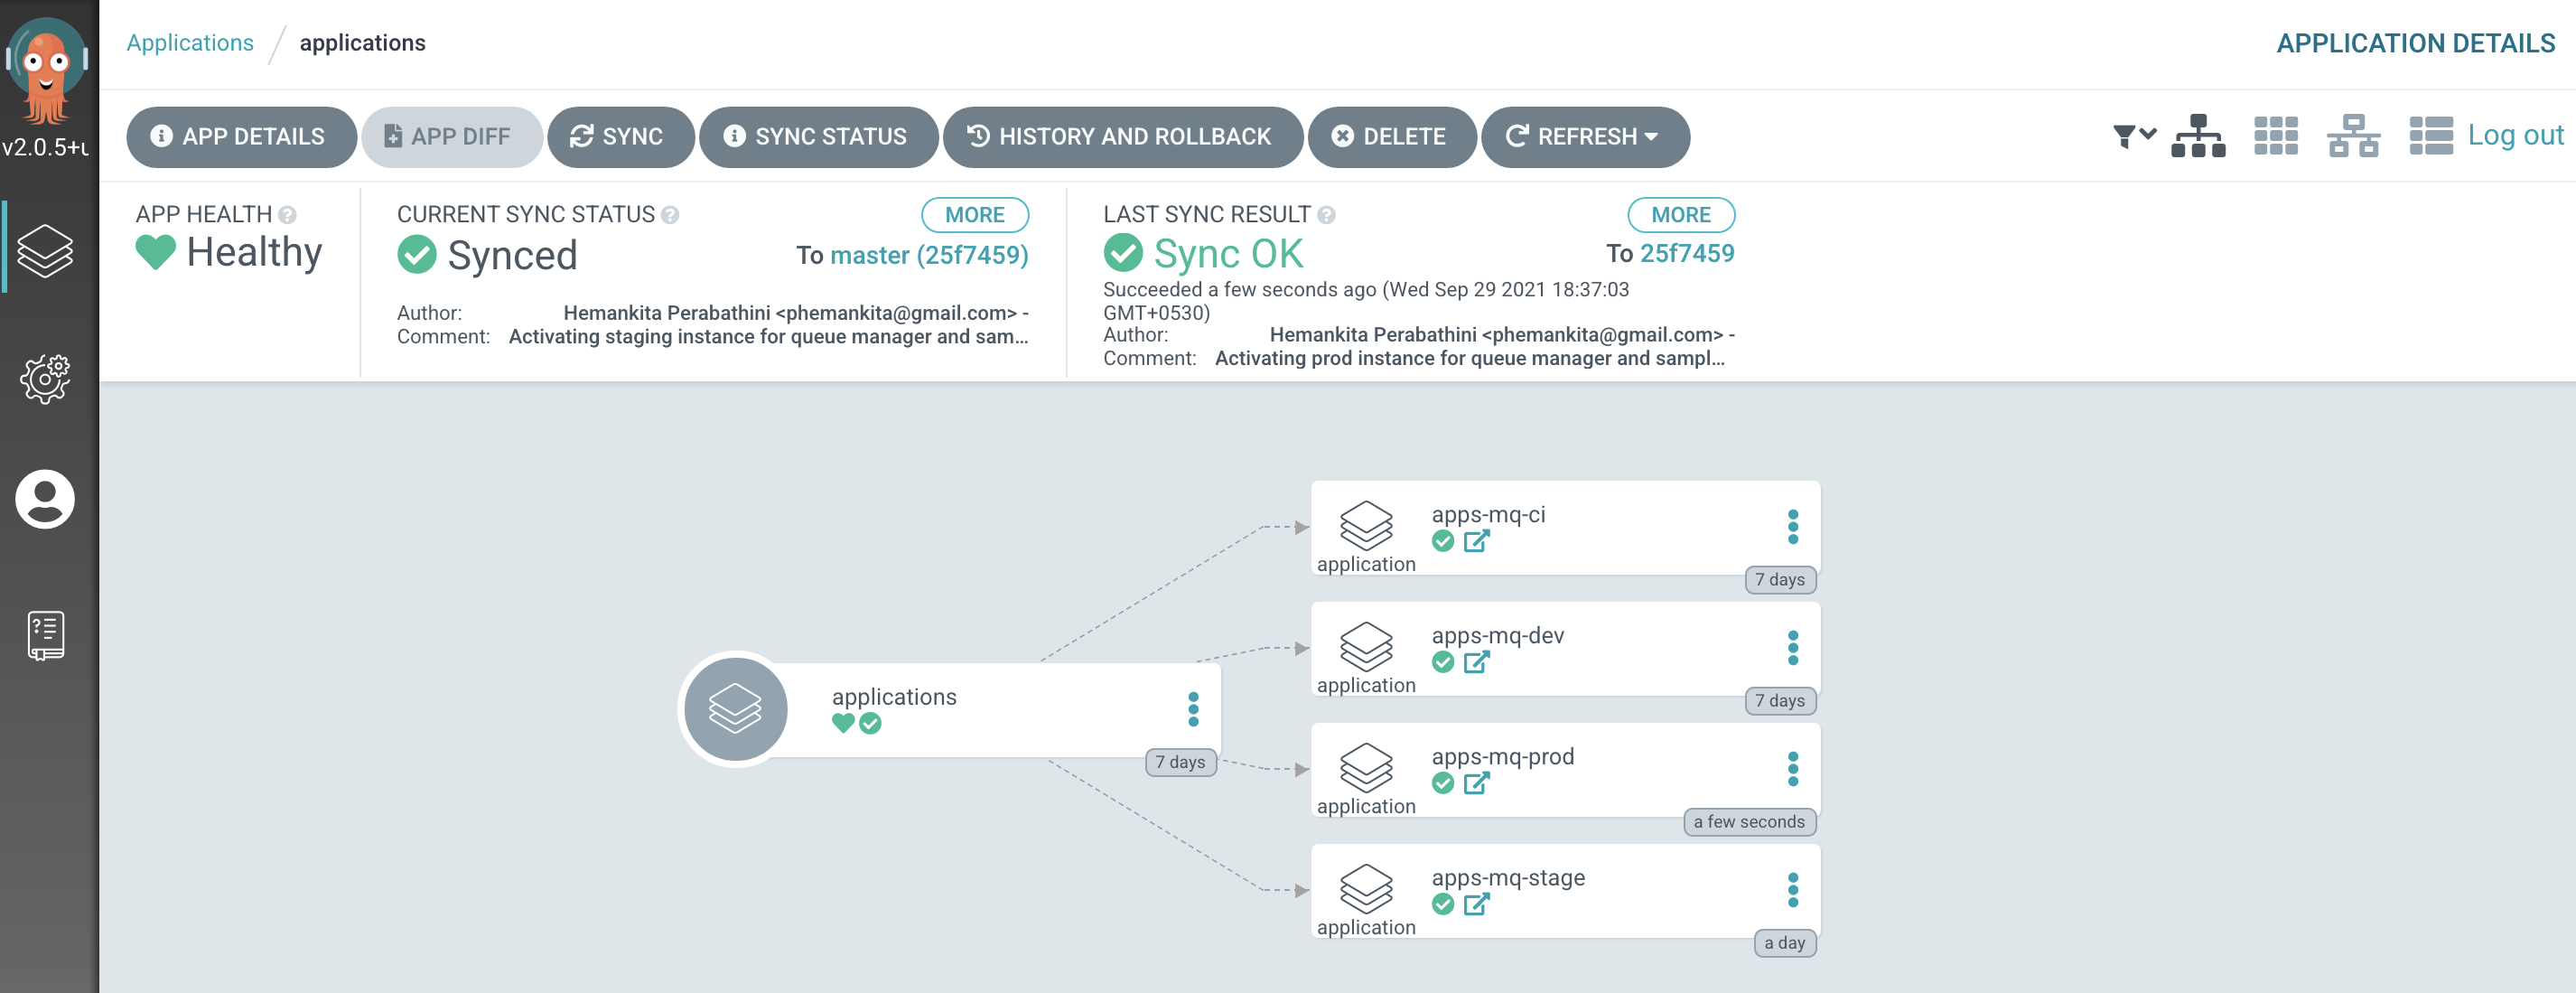
Examine the activated ArgoCD applications
We're now going to examine the activated ArgoCD applications that uses the above resources to manage the deployment of Queue Manager and MQ Sample application to the prod namespace.
Queue Manager
-
The ArgoCD application for Queue Manager
QM1has its deployment to the cluster managed by a dedicated ArgoCD application calledprod-mq-qm01-instance.Issue the following commands to show the ArgoCD application details:
cd $GIT_ROOT
cd multi-tenancy-gitops-apps/

cat mq/config/argocd/prod/prod-mq-qm01-instance.yaml
which shows a YAML file typical of those we've seen before:
apiVersion: argoproj.io/v1alpha1
kind: Application
metadata:
  name: prod-mq-qm01-instance
  annotations:
    argocd.argoproj.io/sync-wave: "300"
  finalizers:
    - resources-finalizer.argocd.argoproj.io
spec:
  destination:
    namespace: prod
    server: https://kubernetes.default.svc
  project: applications
  source:
    path: mq/environments/prod/mq-qm01/
    repoURL: https://github.com/prod-ref-guide/multi-tenancy-gitops-apps.git
    targetRevision: master
  syncPolicy: {}
See how the resources we explored in the previous section of this topic is referenced by
path: mq/environments/prod/mq-qm01/:mq/environments/prod/mq-qm01/queuemanager/ └── queuemanager.yamlThe ArgoCD application applies these resources to the cluster to instantiate
QM1as a set of cluster resources. -
Look at active
Queue ManagerArgoCD applicationLet's examine
QM1and its Kubernetes resources using the ArgoCD UI.In the ArgoCD UI search the Applications view with the keyword
prod-mq-qm01:(You may need to launch the ArgoCD UI again. Refer to these instructions.)
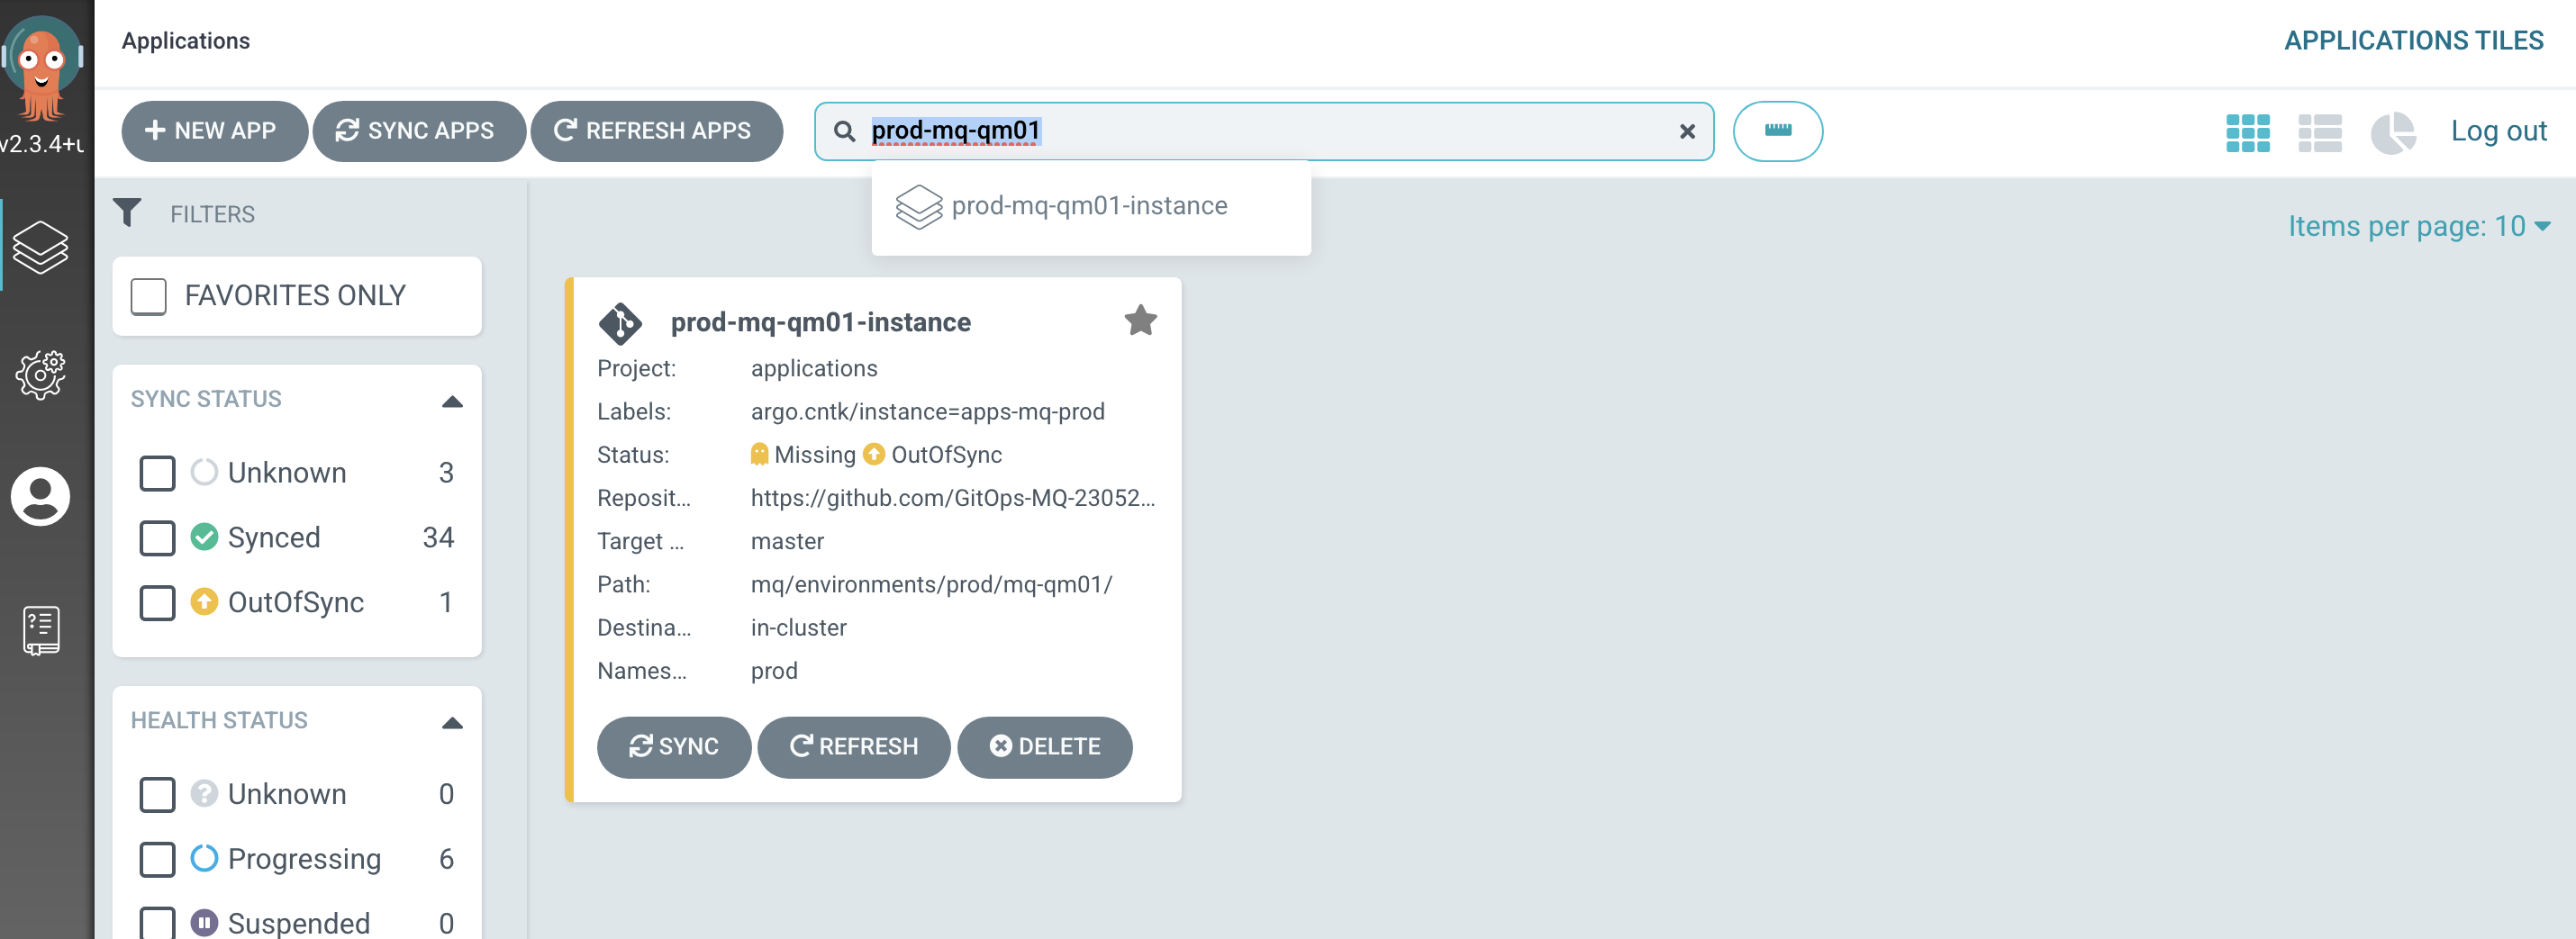
Click on the
prod-mq-qm01-instanceArgoCD application and then clickSync: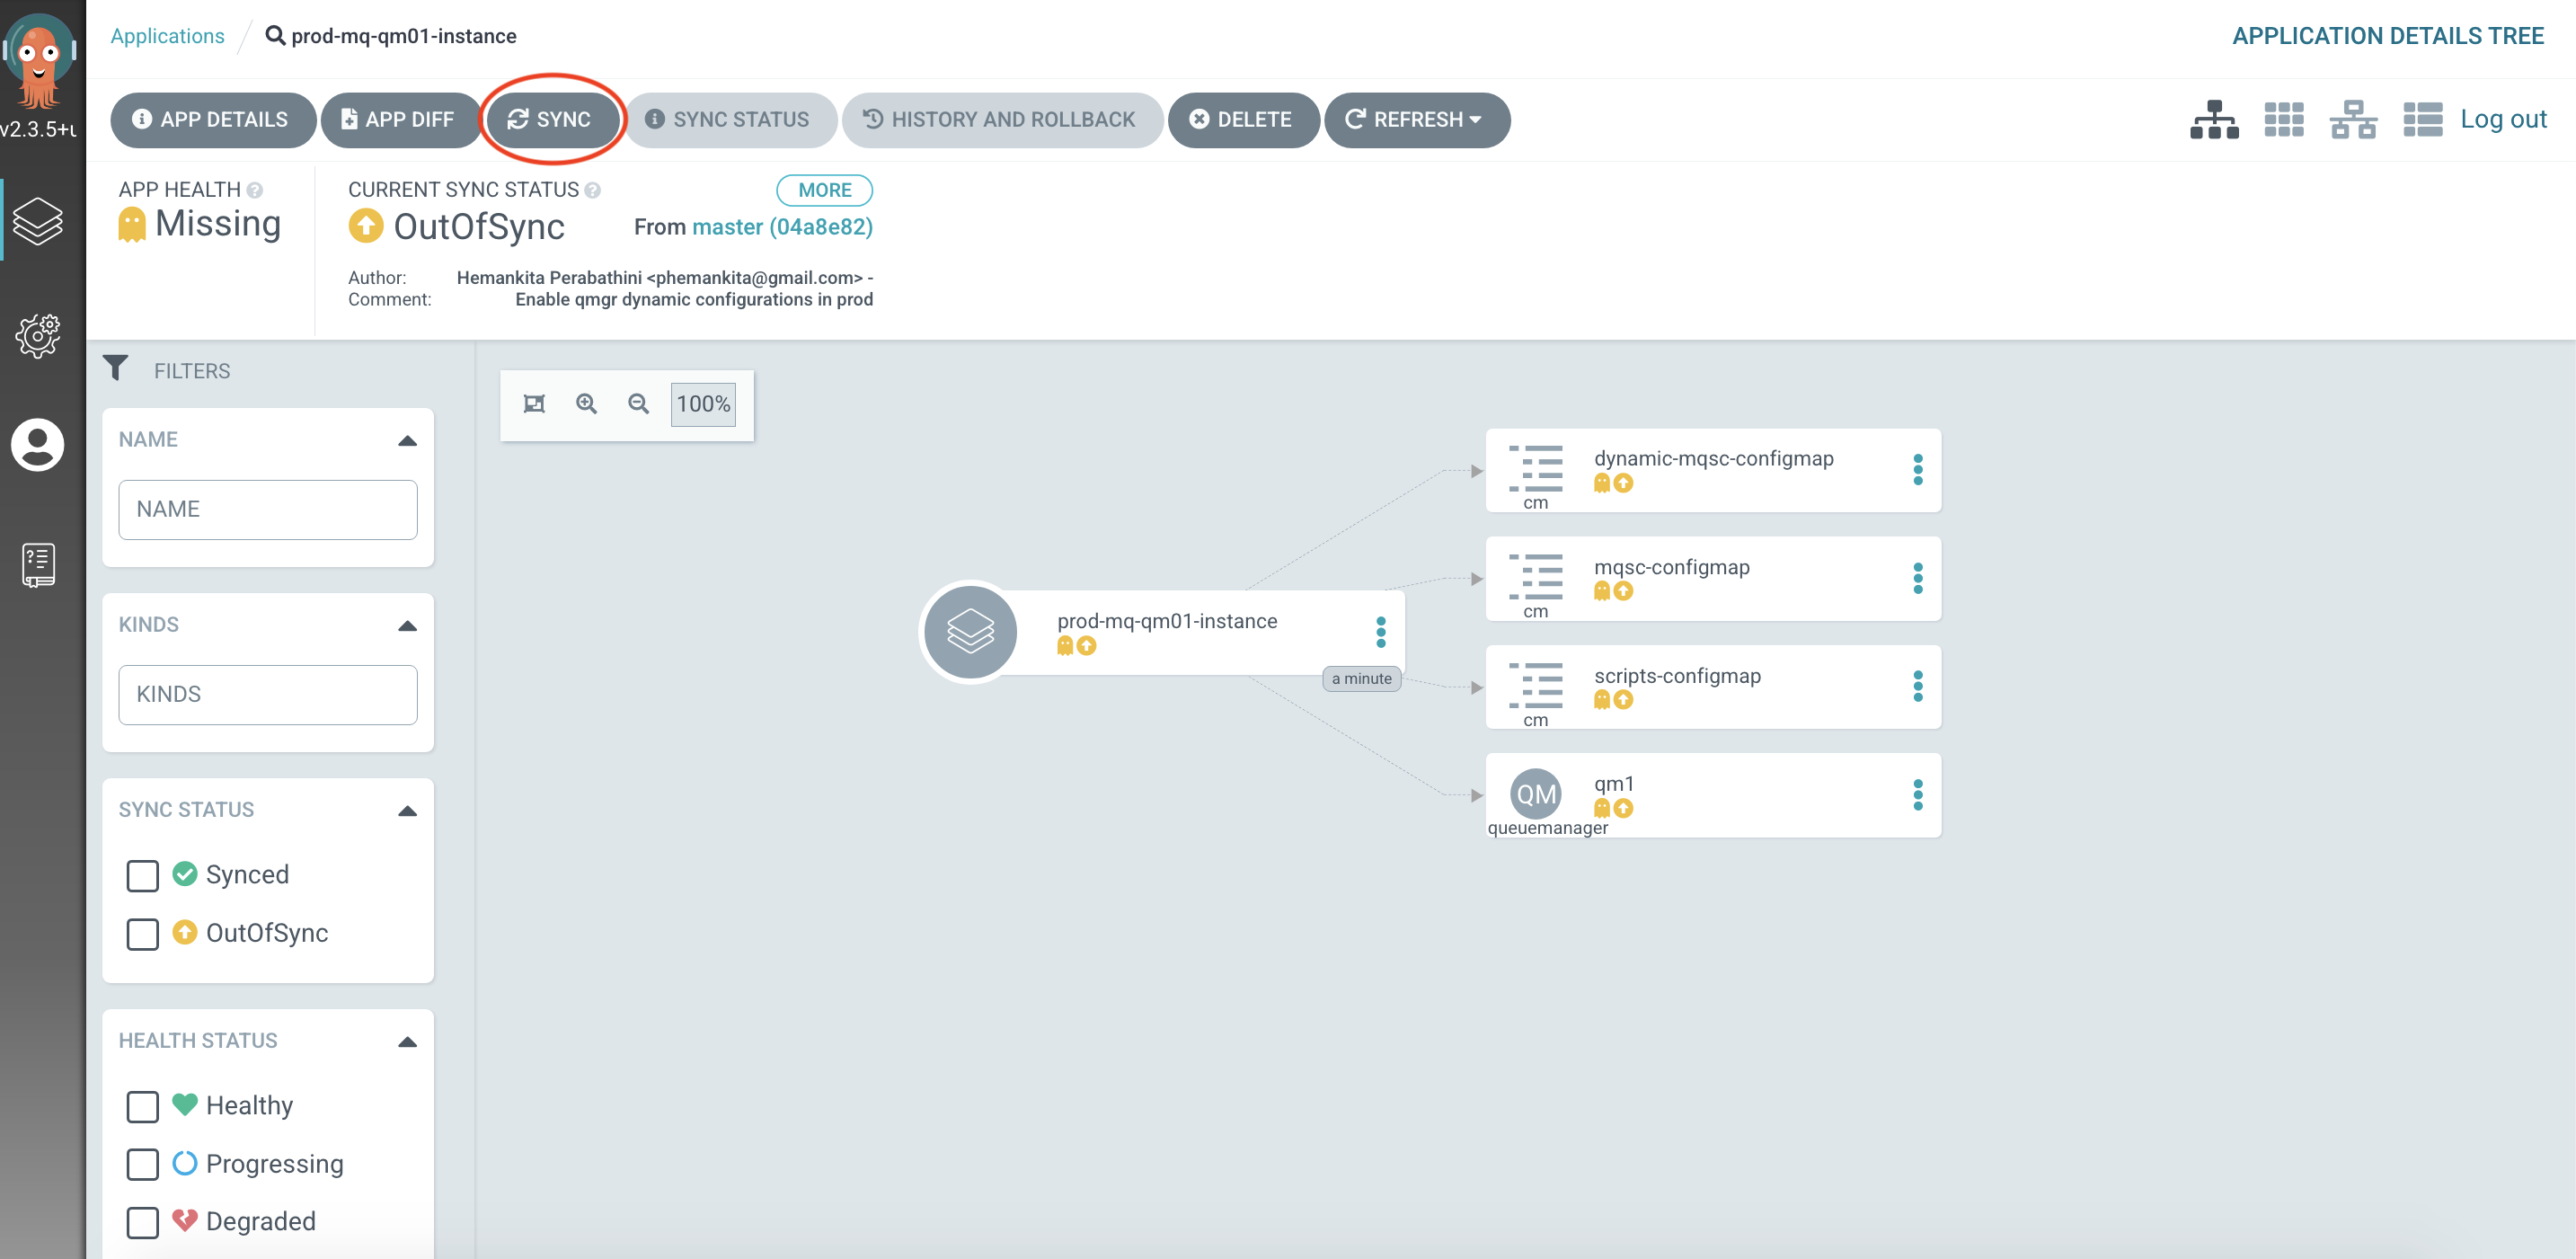
-
View the new
Queue ManagerKubernetes resourcesWe can look at the deployed instance of
QM1and its dependent kubernetes resources.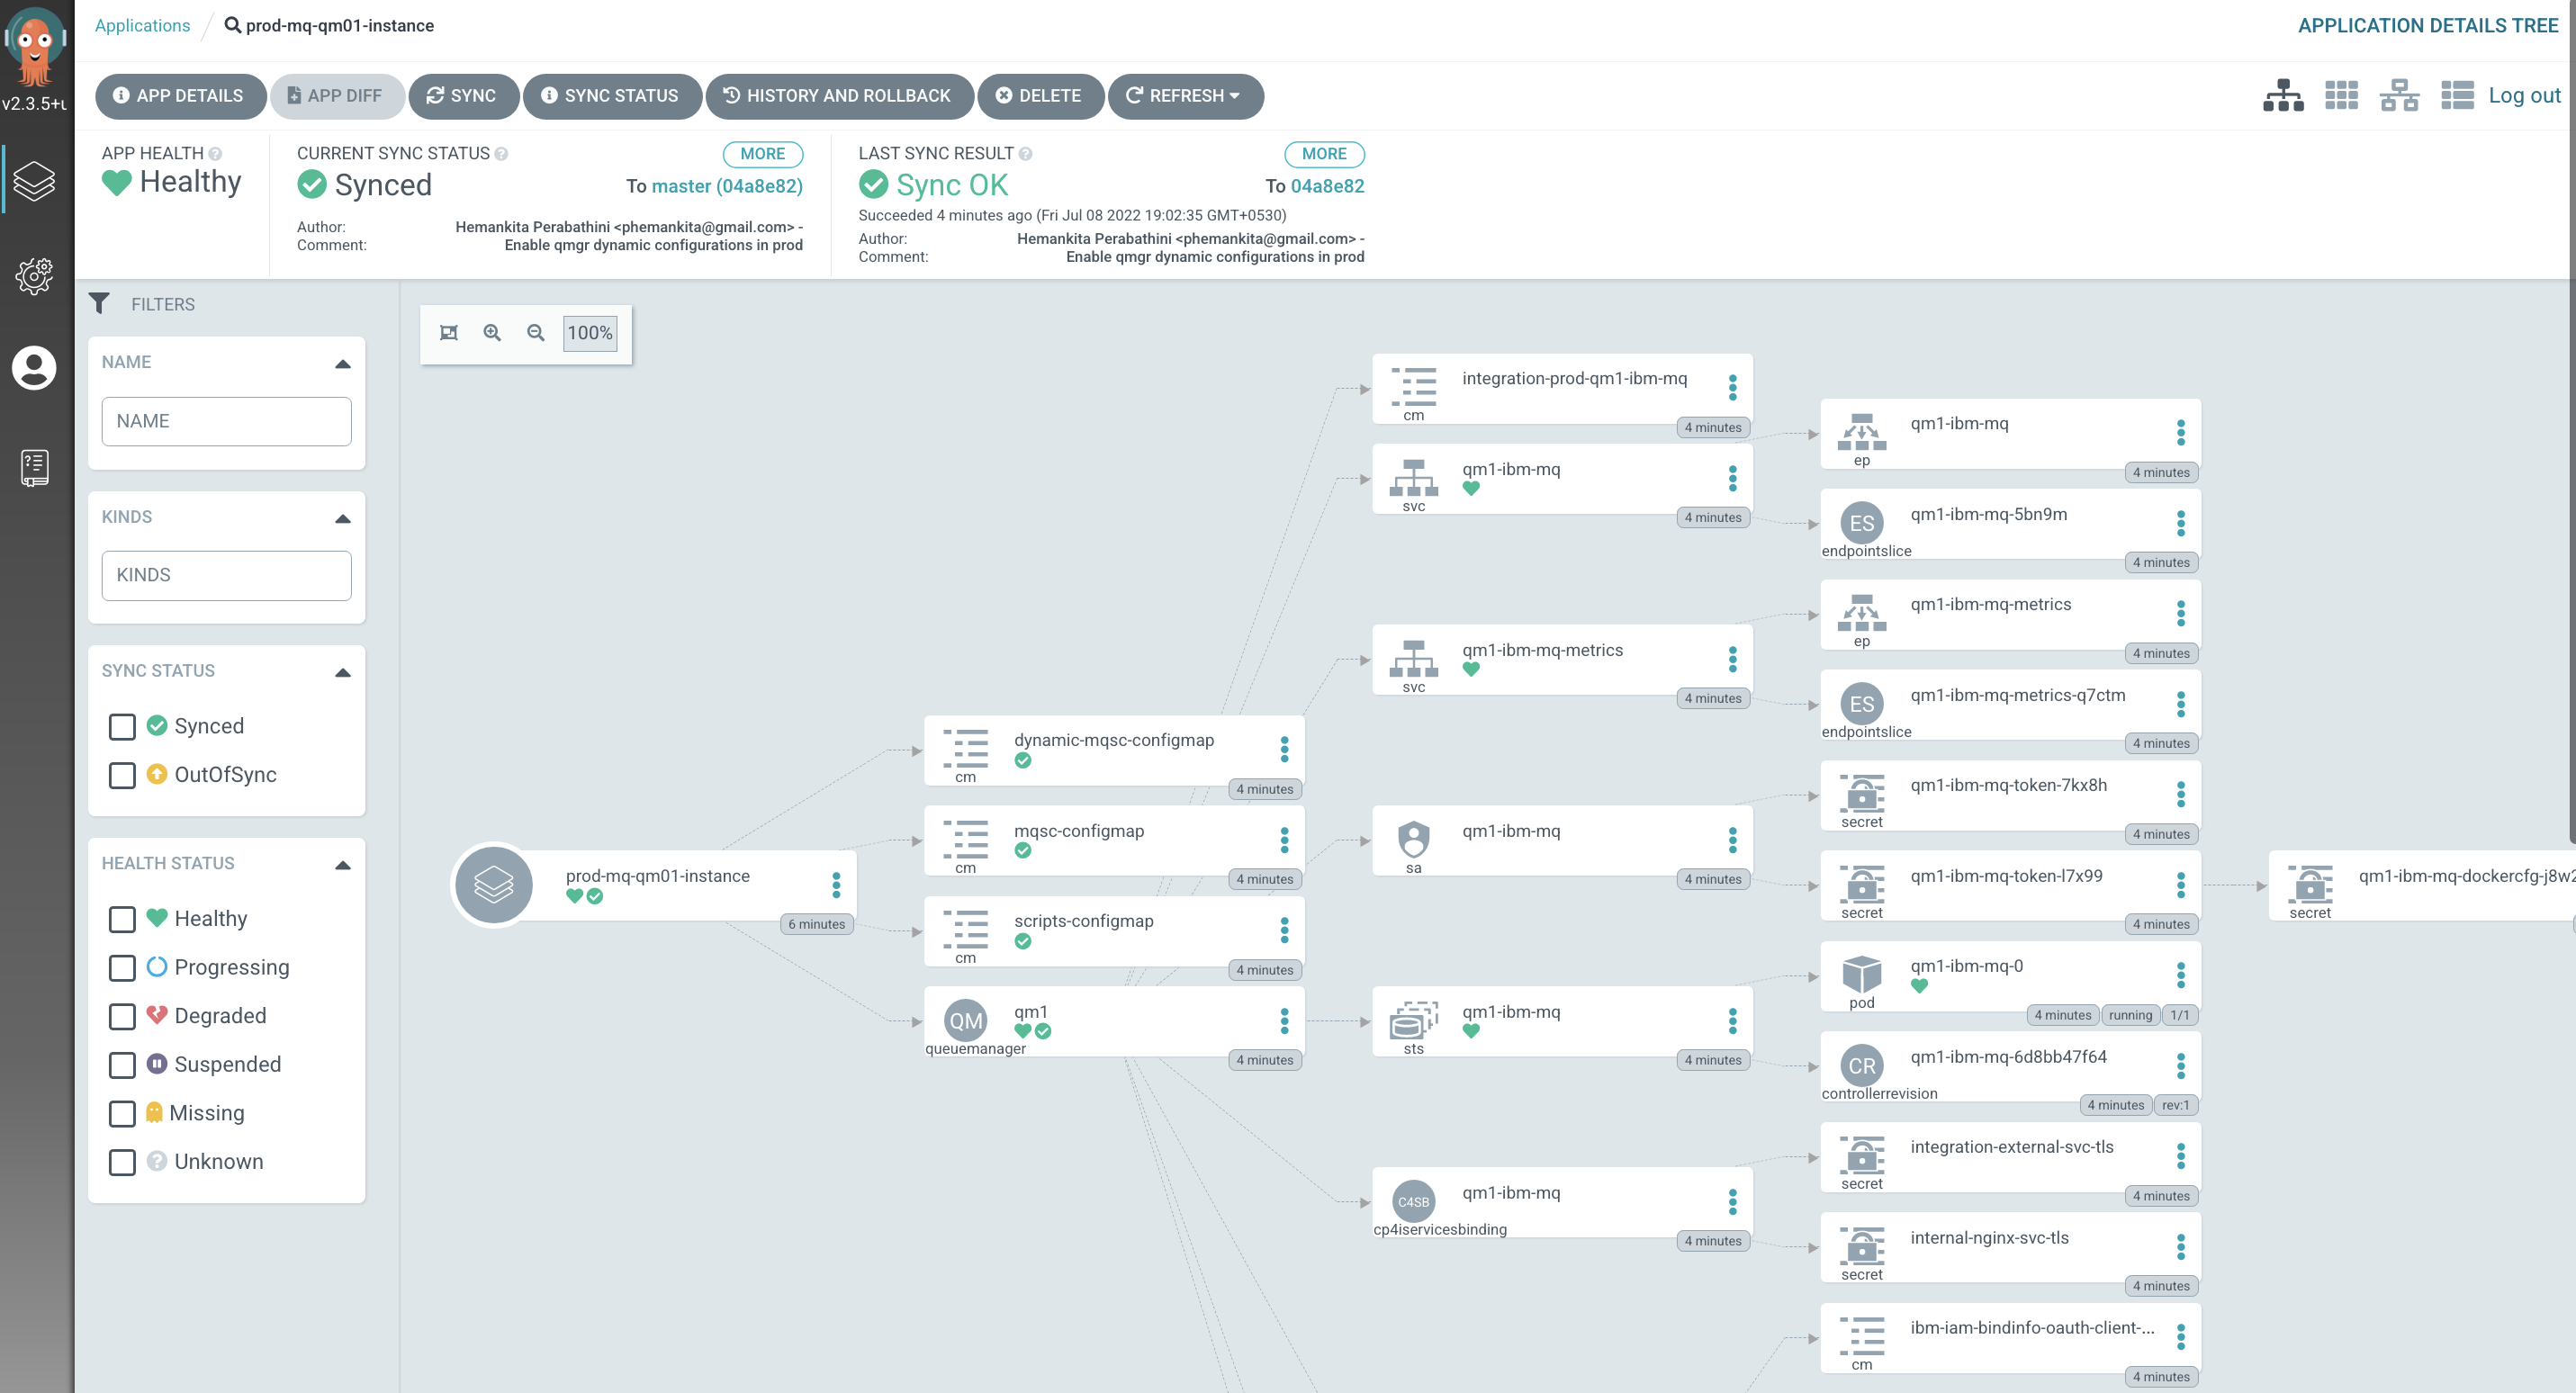
MQ Sample Application
-
The ArgoCD application for MQ Sample Application
MQ Sample Applicationhas its deployment to the cluster managed by a dedicated ArgoCD application calledprod-mq-spring-app-instance.Issue the following command to show the ArgoCD application details:
cd $GIT_ROOT
cd multi-tenancy-gitops-apps

cat mq/config/argocd/prod/prod-mq-spring-app-instance.yaml
which shows a YAML file typical of those we've seen before:
apiVersion: argoproj.io/v1alpha1
kind: Application
metadata:
  name: prod-mq-spring-app-instance
  annotations:
    argocd.argoproj.io/sync-wave: "300"
  finalizers:
    - resources-finalizer.argocd.argoproj.io
spec:
  destination:
    namespace: prod
    server: https://kubernetes.default.svc
  project: applications
  source:
    path: mq/environments/prod/mq-spring-app/
    repoURL: https://github.com/prod-ref-guide/multi-tenancy-gitops-apps.git
    targetRevision: master
  syncPolicy:
    automated:
      prune: true
      selfHeal: true
See how the resources we explored in the previous section of this topic is referenced by
path: mq/environments/prod/mq-spring-app/:mq/environments/prod/mq-spring-app/deployment/ └── deployment.yamlThe ArgoCD application applies these resources to the cluster to instantiate
MQ Sample Applicationas a set of cluster resources. -
Look at active
MQ Sample ApplicationArgoCD applicationLet's examine
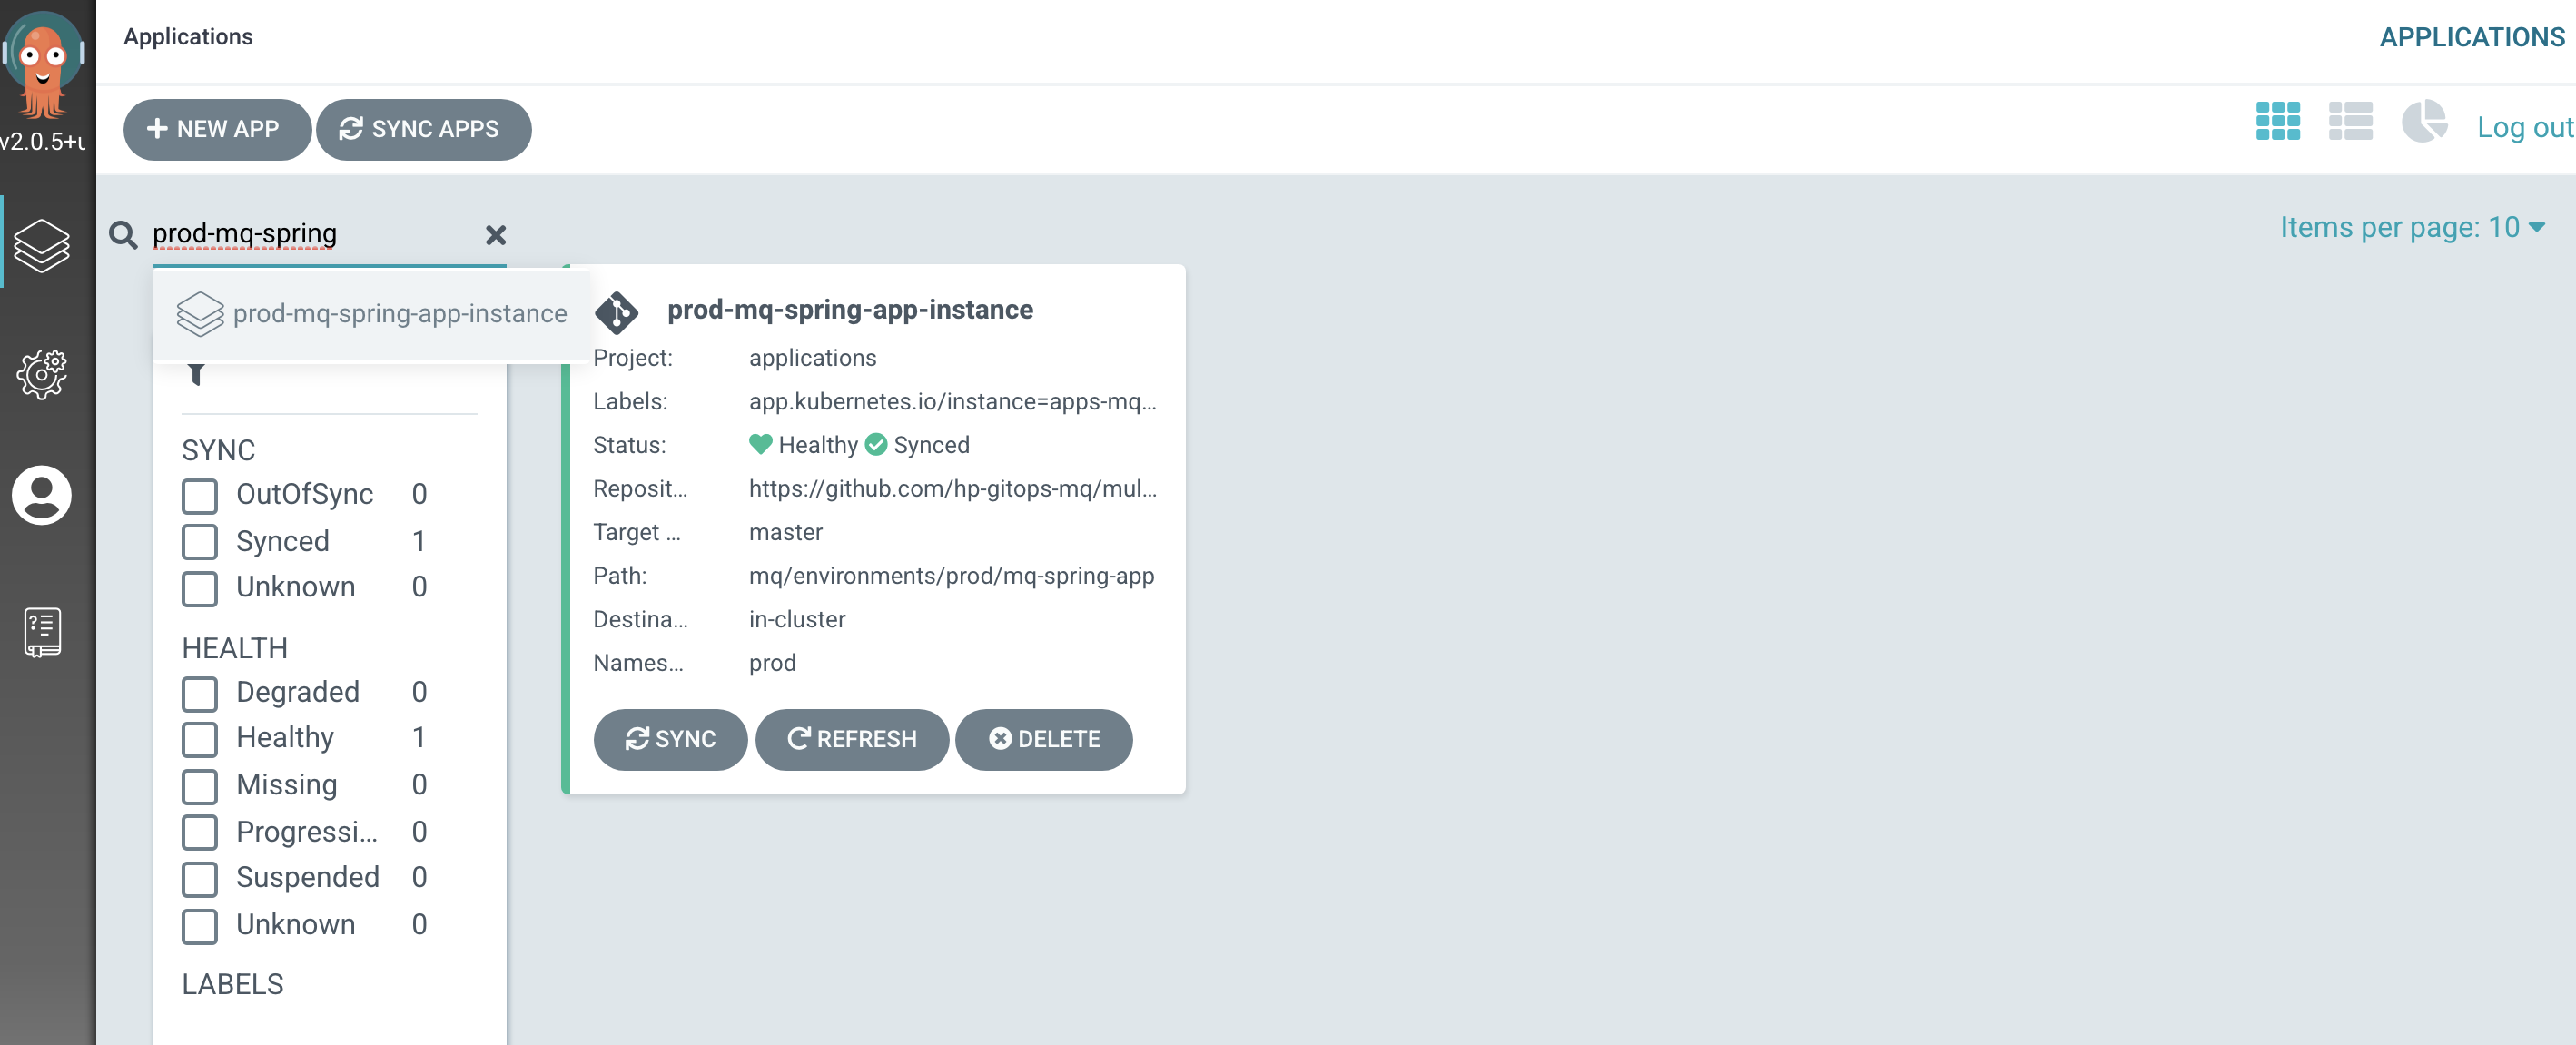
MQ Sample Applicationand its Kubernetes resources using the ArgoCD UI.In the ArgoCD UI search the Applications view with the keyword
prod-mq-spring:(You may need to launch the ArgoCD UI again. Refer to these instructions.)
-
View the new
MQ Sample ApplicationKubernetes resourcesWe can look at the deployed instance of
MQ Sample Applicationand its dependent kubernetes resources.Click on the
prod-mq-spring-app-instanceArgoCD application: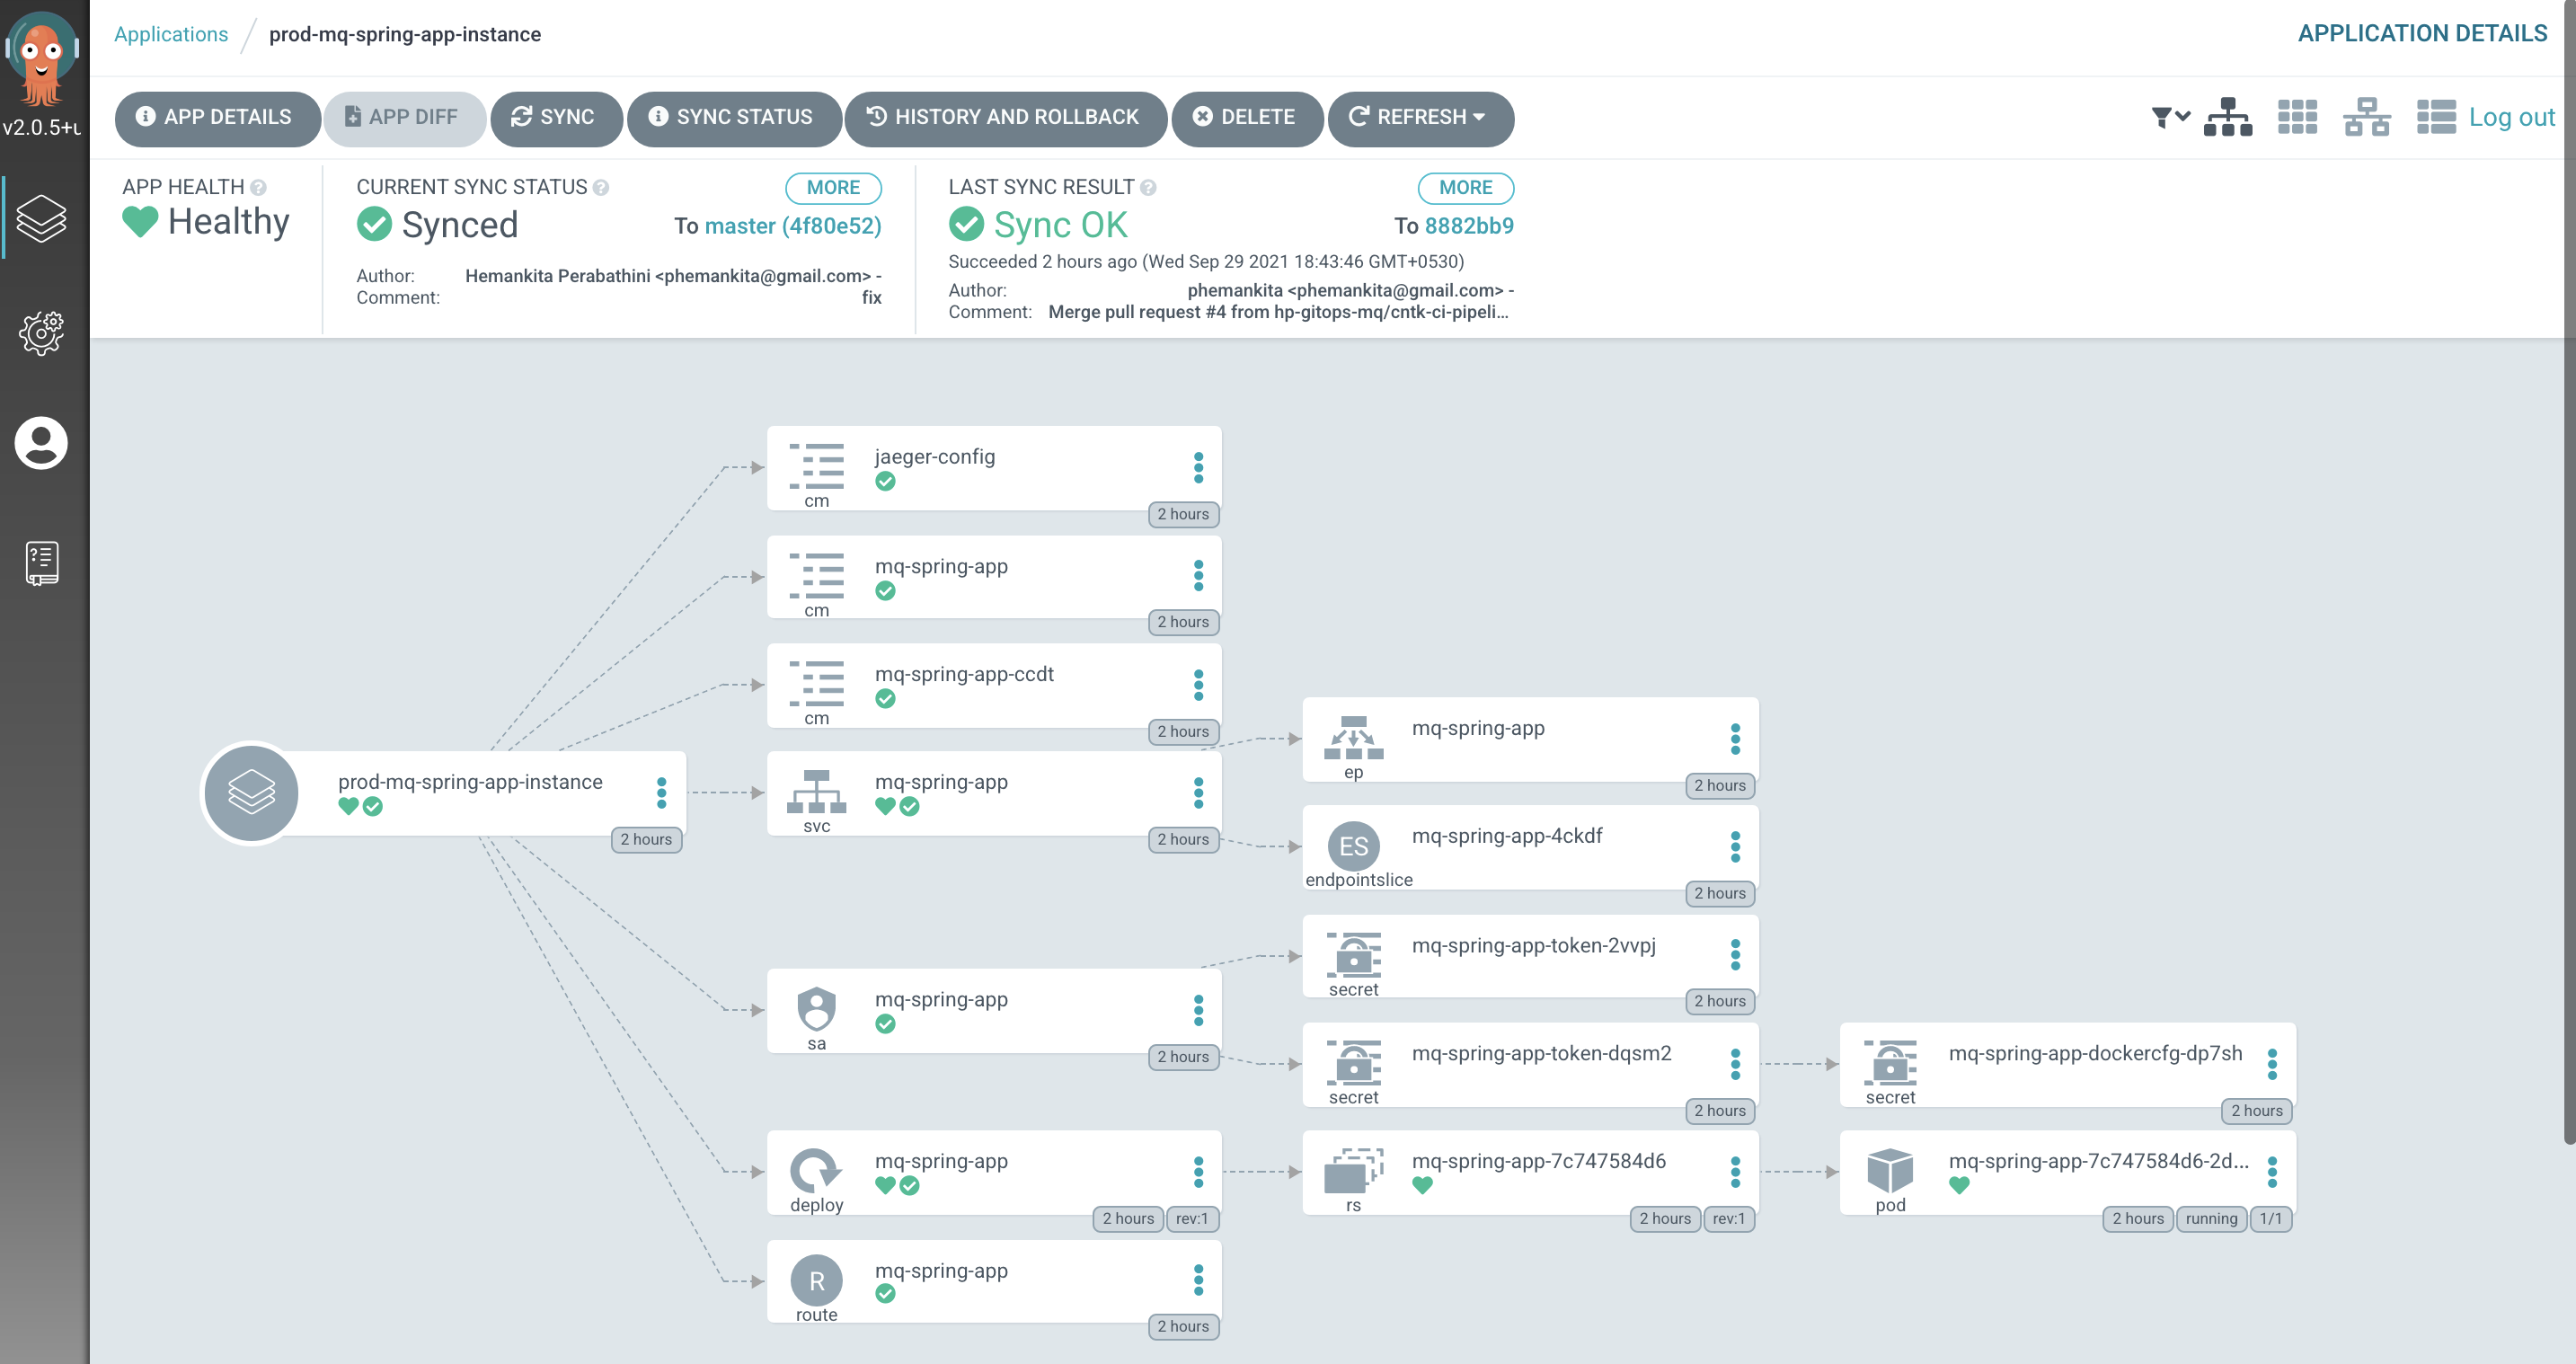
Validate the Queue Manager
-
Connect to the queue manager pod
Let's connect to this container, so that we can explore the queue manager.
Issue the following command:
oc exec -n prod qm1-ibm-mq-0 -it -- /bin/bashto connect you to the pod default container, where you'll see the
bashprompt:bash-4.4$Your terminal is now connected to the container running the queue manager.
-
Use MQ command line
The container we've connected to has a fully running instance of the queue manager configured according to the YAML generated by the Helm chart. We can use regular MQ commands to verify that this is a regular queue manager.
Issue the following command:
dspmq -o allto see a full list of the queue managers running in the container:
QMNAME(QM1) STATUS(Running) DEFAULT(yes) STANDBY(Permitted) INSTNAME(Installation1) INSTPATH(/opt/mqm) INSTVER(9.2.3.0) ROLE(Not configured) INSTANCE() INSYNC() QUORUM()We can see that
QM1is running, it's the default queue manager, where it's installed in the container file system, and it's version. -
Display queue manager properties
We can also run an MQSC command to display the queue manager properties. These properties were defined in the MQSC file.
Issue the following command:
runmqsc QM1 <<< "dis qmgr"to see the full set of queue manager properties for
QM1:5724-H72 (C) Copyright IBM Corp. 1994, 2021. Starting MQSC for queue manager QM1. 1 : dis qmgr AMQ8408I: Display Queue Manager details. QMNAME(QM1) ACCTCONO(DISABLED) ACCTINT(1800) ACCTMQI(OFF) ACCTQ(OFF) ACTIVREC(MSG) ACTVCONO(DISABLED) ACTVTRC(OFF) ADVCAP(ENABLED) ALTDATE(2021-09-29) ALTTIME(14.38.48) AMQPCAP(NO) AUTHOREV(DISABLED) CCSID(819) CERTLABL( ) CERTVPOL(ANY) CHAD(DISABLED) CHADEV(DISABLED) CHADEXIT( ) CHLEV(DISABLED) CHLAUTH(DISABLED) CLWLDATA( ) CLWLEXIT( ) CLWLLEN(100) CLWLMRUC(999999999) CLWLUSEQ(LOCAL) CMDEV(DISABLED) CMDLEVEL(923) COMMANDQ(SYSTEM.ADMIN.COMMAND.QUEUE) CONFIGEV(DISABLED) CONNAUTH(SYSTEM.DEFAULT.AUTHINFO.IDPWOS) CRDATE(2021-09-29) CRTIME(14.38.45) CUSTOM( ) DEADQ(DEV.DEAD.LETTER.QUEUE) DEFCLXQ(SCTQ) DEFXMITQ( ) DESCR( ) DISTL(YES) IMGINTVL(60) IMGLOGLN(OFF) IMGRCOVO(YES) IMGRCOVQ(YES) IMGSCHED(MANUAL) INHIBTEV(DISABLED) IPADDRV(IPV4) LOCALEV(DISABLED) LOGGEREV(DISABLED) MARKINT(5000) MAXHANDS(256) MAXMSGL(4194304) MAXPROPL(NOLIMIT) MAXPRTY(9) MAXUMSGS(10000) MONACLS(QMGR) MONCHL(OFF) MONQ(OFF) PARENT( ) PERFMEV(DISABLED) PLATFORM(UNIX) PSMODE(ENABLED) PSCLUS(ENABLED) PSNPMSG(DISCARD) PSNPRES(NORMAL) PSRTYCNT(5) PSSYNCPT(IFPER) QMID(QM1_2021-09-29_14.38.45) REMOTEEV(DISABLED) REPOS( ) REPOSNL( ) REVDNS(ENABLED) ROUTEREC(MSG) SCHINIT(QMGR) SCMDSERV(QMGR) SPLCAP(ENABLED) SSLCRLNL( ) SSLCRYP( ) SSLEV(DISABLED) SSLFIPS(NO) SSLKEYR(/run/runmqserver/tls/key) SSLRKEYC(0) STATACLS(QMGR) STATCHL(OFF) STATINT(1800) STATMQI(OFF) STATQ(OFF) STRSTPEV(ENABLED) SUITEB(NONE) SYNCPT TREELIFE(1800) TRIGINT(999999999) VERSION(09020300) XRCAP(NO) One MQSC command read. No commands have a syntax error. All valid MQSC commands were processed.Note how
CHLAUTH(DISABLED)has been set. This was set in the MQSC file configuration forQM1in via themqsc-configmapconfigmap.Feel free to run other
runmqsccommands to explore the queue manager properties. -
Display the dynamic queues
We can also run an MQSC command to check if the dynamic queue got created.
Issue the following command:
runmqsc QM1 <<< "dis qlocal(PRODTEST.DYNAMIC.QUEUE)"to see the full set of queue properties for
PRODTEST.DYNAMIC.QUEUE:5724-H72 (C) Copyright IBM Corp. 1994, 2021. Starting MQSC for queue manager QM1. 1 : dis qlocal(PRODTEST.DYNAMIC.QUEUE) AMQ8409I: Display Queue details. QUEUE(PRODTEST.DYNAMIC.QUEUE) TYPE(QLOCAL) ACCTQ(QMGR) ALTDATE(2022-07-08) ALTTIME(13.33.25) BOQNAME( ) BOTHRESH(0) CLUSNL( ) CLUSTER( ) CLCHNAME( ) CLWLPRTY(0) CLWLRANK(0) CLWLUSEQ(QMGR) CRDATE(2022-07-08) CRTIME(13.33.25) CURDEPTH(0) CUSTOM( ) DEFBIND(OPEN) DEFPRTY(0) DEFPSIST(NO) DEFPRESP(SYNC) DEFREADA(NO) DEFSOPT(SHARED) DEFTYPE(PREDEFINED) DESCR( ) DISTL(NO) GET(ENABLED) HARDENBO IMGRCOVQ(QMGR) INITQ( ) IPPROCS(0) MAXDEPTH(5000) MAXMSGL(4194304) MAXFSIZE(DEFAULT) MONQ(QMGR) MSGDLVSQ(PRIORITY) NOTRIGGER NPMCLASS(NORMAL) OPPROCS(0) PROCESS( ) PUT(ENABLED) PROPCTL(COMPAT) QDEPTHHI(80) QDEPTHLO(20) QDPHIEV(DISABLED) QDPLOEV(DISABLED) QDPMAXEV(ENABLED) QSVCIEV(NONE) QSVCINT(999999999) RETINTVL(999999999) SCOPE(QMGR) SHARE STATQ(QMGR) STREAMQ( ) STRMQOS(BESTEF) TRIGDATA( ) TRIGDPTH(1) TRIGMPRI(0) TRIGTYPE(FIRST) USAGE(NORMAL) One MQSC command read. No commands have a syntax error. All valid MQSC commands were processed. -
Exit from queue manager container
When we're finished exploring the queue manager container, we can exit it.
Issue the following command:
exitto return to your local machine's command prompt.
Validate the Application
-
Check the application is running
Using the
locationvalue from theroutewe can call the application to check its health by appending/health, for example:export PROD_APP_URL=$(oc get route -n prod mq-spring-app -o jsonpath="{.spec.host}") curl -X GET https://$PROD_APP_URL/actuator/health{"status":"UP","components":{"HeathEndPointMain":{"status":"UP"},"diskSpace":{"status":"UP","details":{"total":105552732160,"free":74679922688,"threshold":10485760,"exists":true}},"jms":{"status":"UP","details":{"provider":"IBM MQ JMS Provider"}},"livenessState":{"status":"UP"},"ping":{"status":"UP"},"readinessState":{"status":"UP"}},"groups":["liveness","readiness"]} -
Call the application to put a message to a queue
Using the same
locationvalue we can call the application to to put a message to a queue on the queue manager, for example:curl -X GET https://$PROD_APP_URL/api/send-hello-world -
Call the application to get a message from a queue
Using the same
locationvalue we can call the application to to get a message from a queue on the queue manager, for example:curl -X GET https://$PROD_APP_URL/api/recv -
Call the application to put a JSON message to a queue
Using the same
locationvalue we can call the application to to put a message with a JSON payload to a queue on the queue manager, for example:curl -X POST -H "Content-Type: application/json" https://$PROD_APP_URL/api/send-json --data "{\"data\":\"Hola Mundo\"}"Note the use of the
POSTverb in the above command. This can be followed with a call to get the message from the queue.
Congratulations!
You've completed your first run of the promotion pipeline from dev to staging.
Feel free to run the ibm-mq-promote-stage-prod pipeline more than once to get a feeling for how it works.
You've used it to promote an instance of QM1 and MQ sample application from staging environment to prod environment in the cluster. You've explored how the promotion pipeline for staging to prod is structured as tasks and steps. You've examined it's pipeline run log to understand how this pipeline works and how tasks are implemented. Finally, you've examined how the GitOps apps repository is updated with the prod resources from a successful run of the pipeline.
You've completed set up continuous deployment for the Queue Manager as well as the MQ sample application and deployed their instances to the prod namespace in the cluster. You've interacted with this queue manager using the command line as well as verified the application.
In the next topic of this chapter we're going to see how we can automatically promote the changes across environments.